Experiments in Physics · Device fabrication
Graphene Characterization
Make 20 graphene devices, wire them up, and see if they behave the same.
Explore the engineering ↓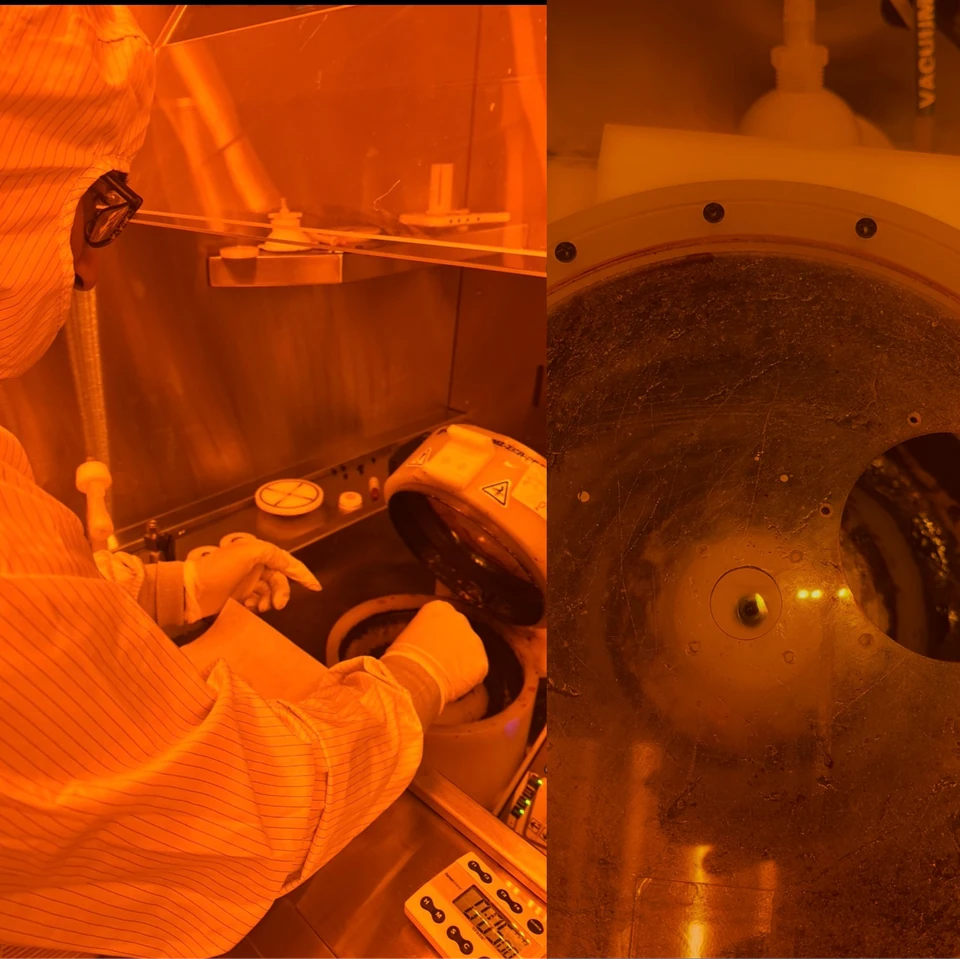
- My role
- Fabrication and measurement, with my lab partner Hunter
- Status
- 20 devices measured
- Focus
- Lithography · wire bonding · transport
What we found
All 20 devices peaked near the same gate voltage, about 1.05 V. Their resistance at the peak varied a lot, though, so the same peak position doesn’t mean identical devices.
- 01
Pattern
Spin-coat resist, expose the pattern, develop it.
- 02
Connect
Wire-bond the chip to the measurement board.
- 03
Sweep
Sweep the gate voltage and record the resistance.
- 04
Compare
Line up all 20 curves and see what matches and what doesn’t.
In the lab
Inside the work.
Spinning a thin, even layer of resist onto the chip before patterning.
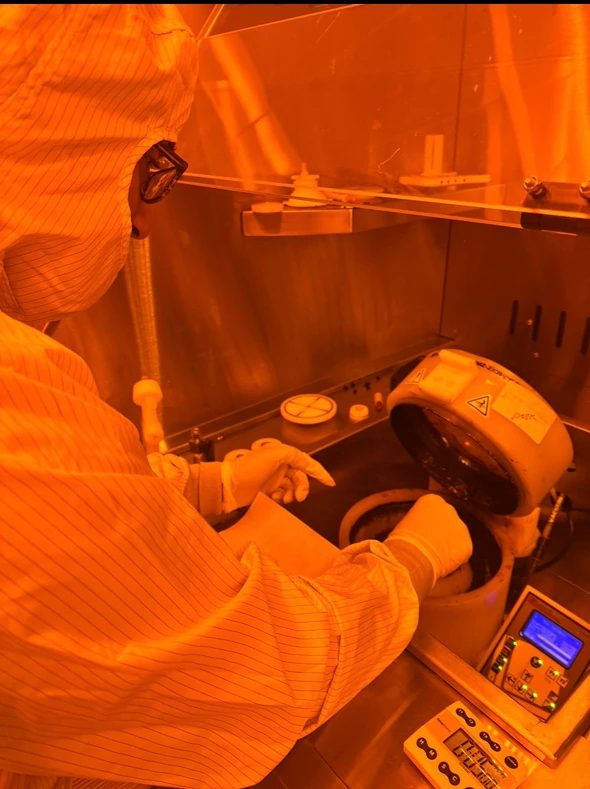
Exposing and developing the device pattern.
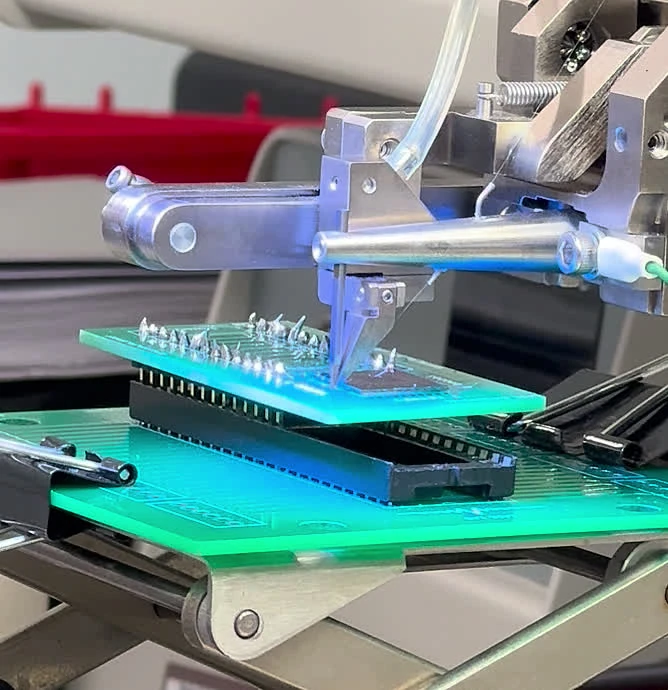
Tiny wires connecting the chip’s pads to the test board.
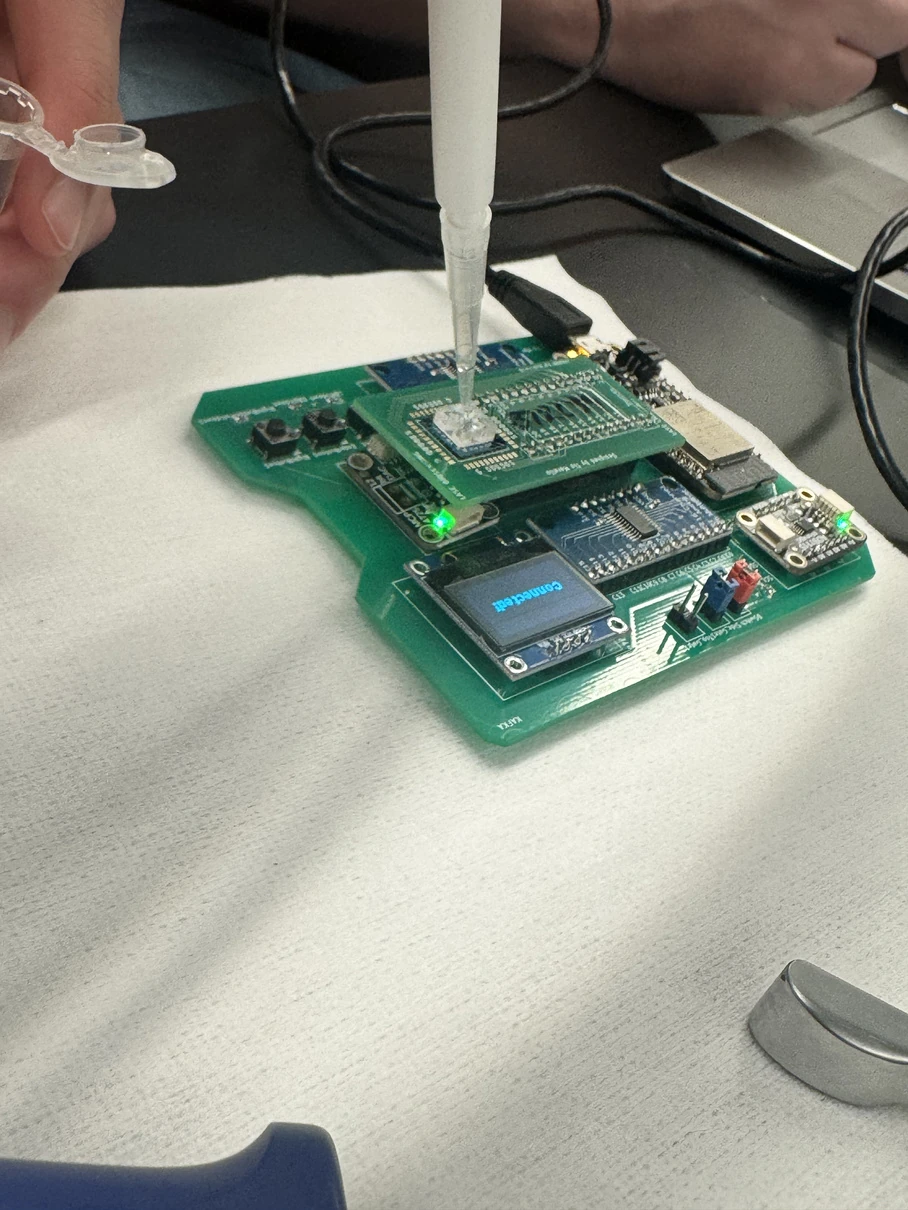
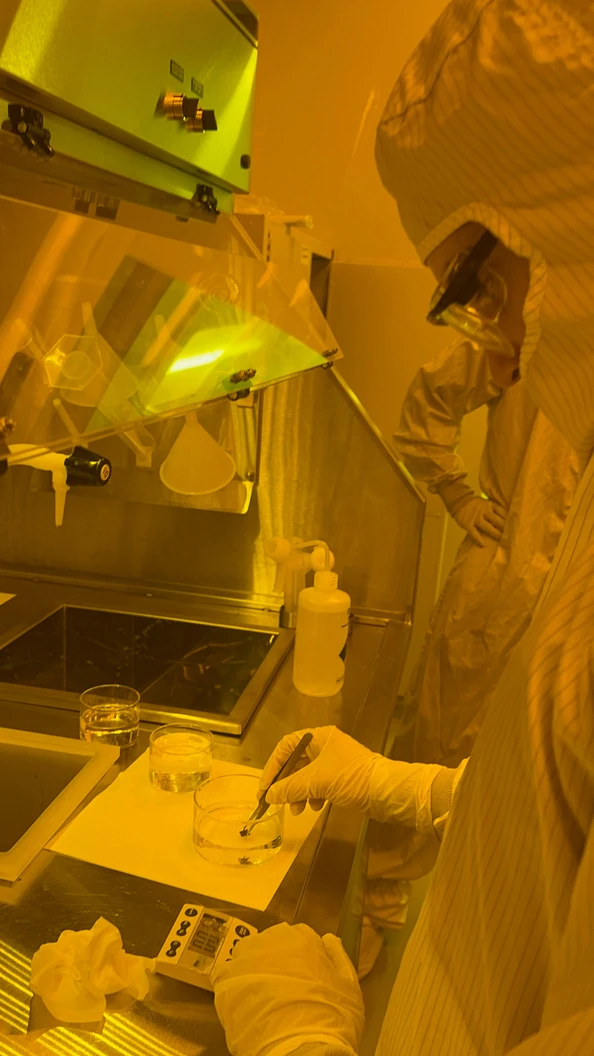
Putting the solution on the device before the gate sweep.
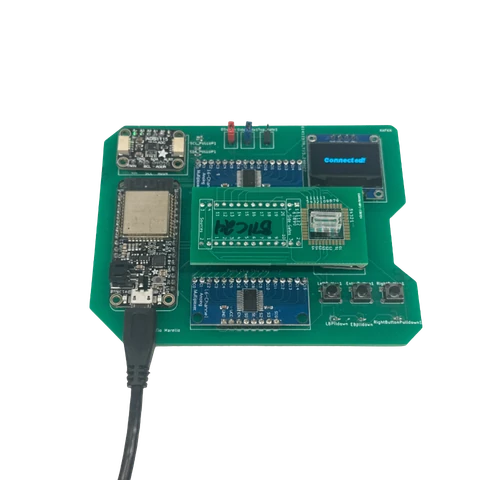
Where the chip meets the electronics that do the measuring.
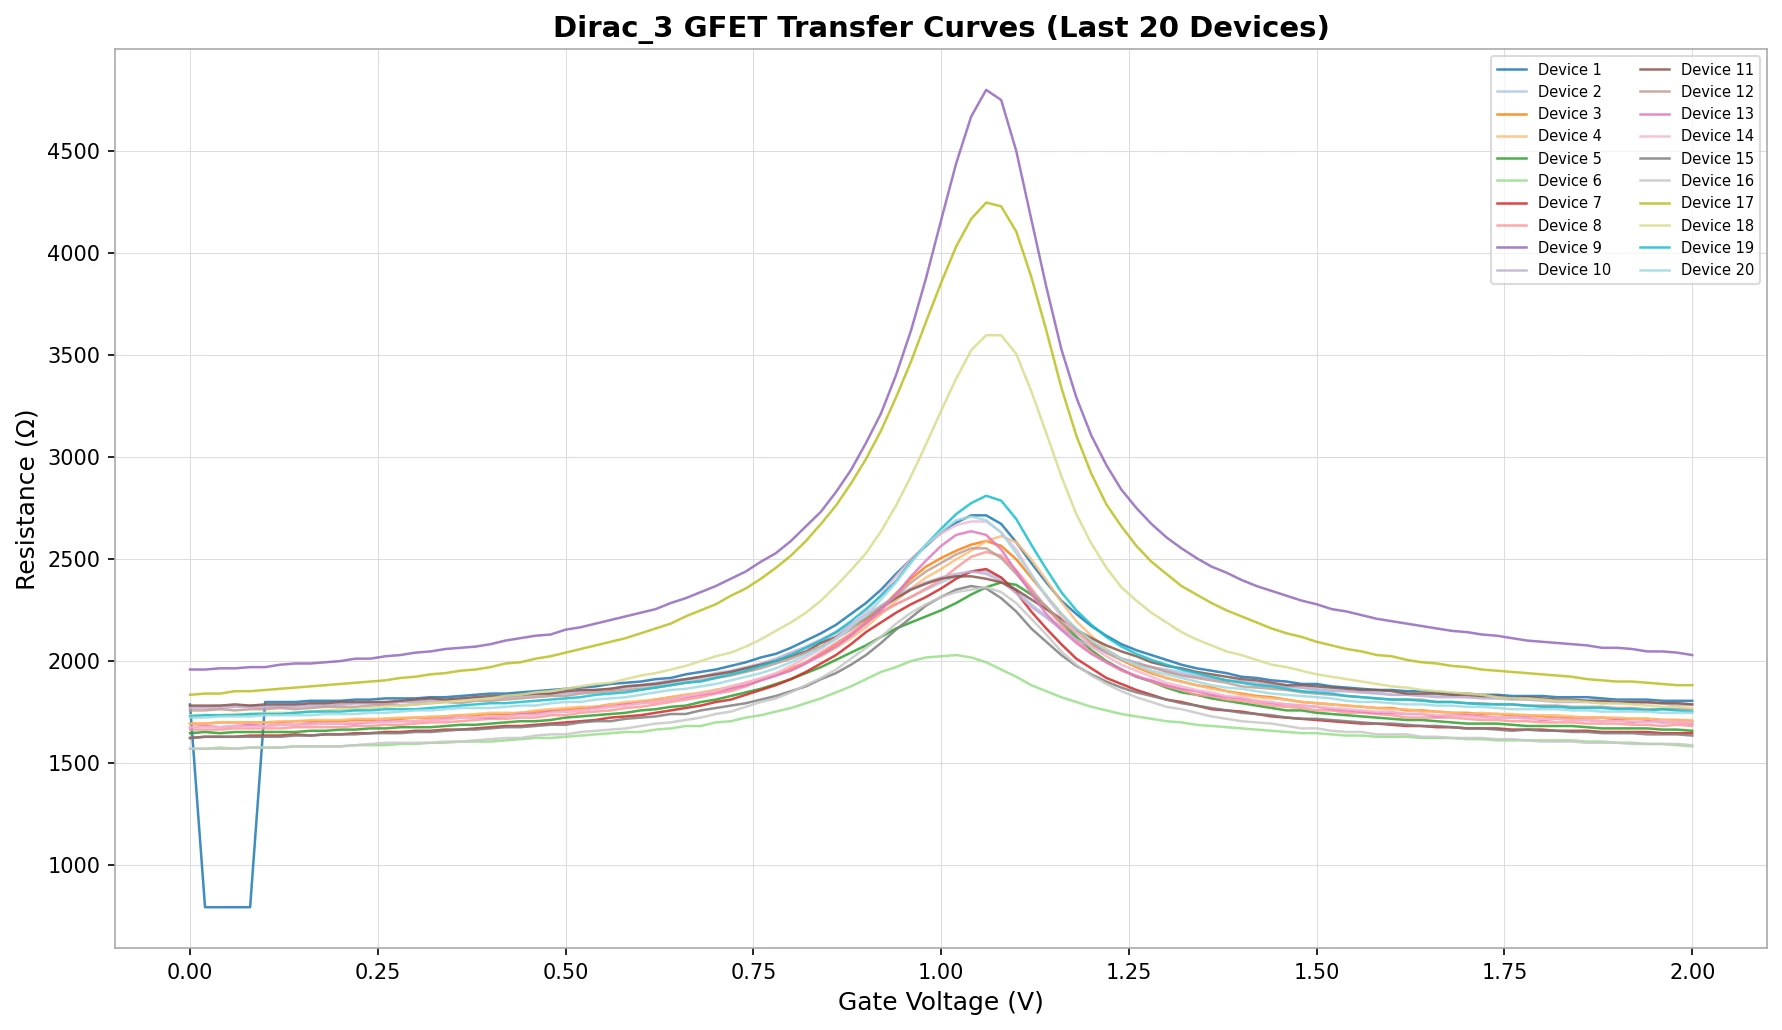
Every curve peaks near the same voltage, but the heights are all over the place.
Making the devices
We went through the whole fabrication chain ourselves: spin coating, hot-plate bakes, exposing the pattern with a maskless aligner (µMLA), developing, checking under the microscope, and wire bonding the chip so we could measure it.
How the measurement works
We put a diluted PBS solution on the device and used it as the gate. Sweeping the gate voltage changes how many charge carriers the graphene has. Resistance climbs to a peak where there are the fewest carriers, the charge-neutrality point, then falls again on the other side. We swept once, then again with finer steps.
What the curves say
All 20 peaks sit near 1.05 V, so the devices respond to the gate the same way. But the peak heights are very different. That spread could come from contact resistance, slightly different shapes, the electrolyte, or how repeatable each sweep was. Separating those would need a control for each one.
What I’d add
The raw sweep data instead of only the plots, repeat sweeps on the same device, and an uncertainty for each curve. With those, we could put an actual number on how uniform our fabrication was instead of judging it by eye.
Sources
Technical records.
Continue exploring.
← Back to Selected Builds