Selected work · 13
MARS.
Finding craters in Mars CTX imagery with a controlled Faster R-CNN experiment: geospatial labels, frozen data splits, and an honest accounting of detections and misses.
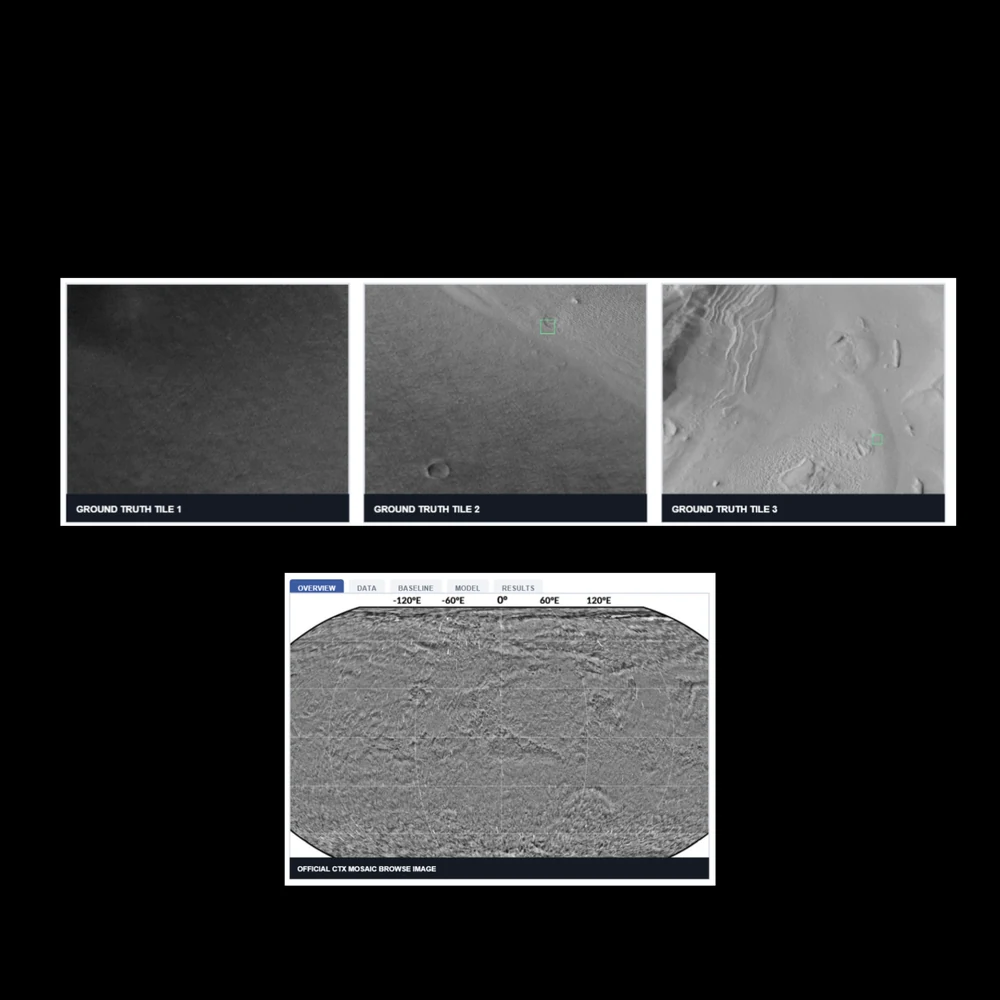
- Region
- S2 Eastern Hellas
- Data
- Murray Lab CTX · approximately 5 m/pixel
- Model
- Faster R-CNN · ResNet50-FPN-v2
- Latest saved test
- F1 0.400 · AP50 0.263
Images & documentation
Inside the project.
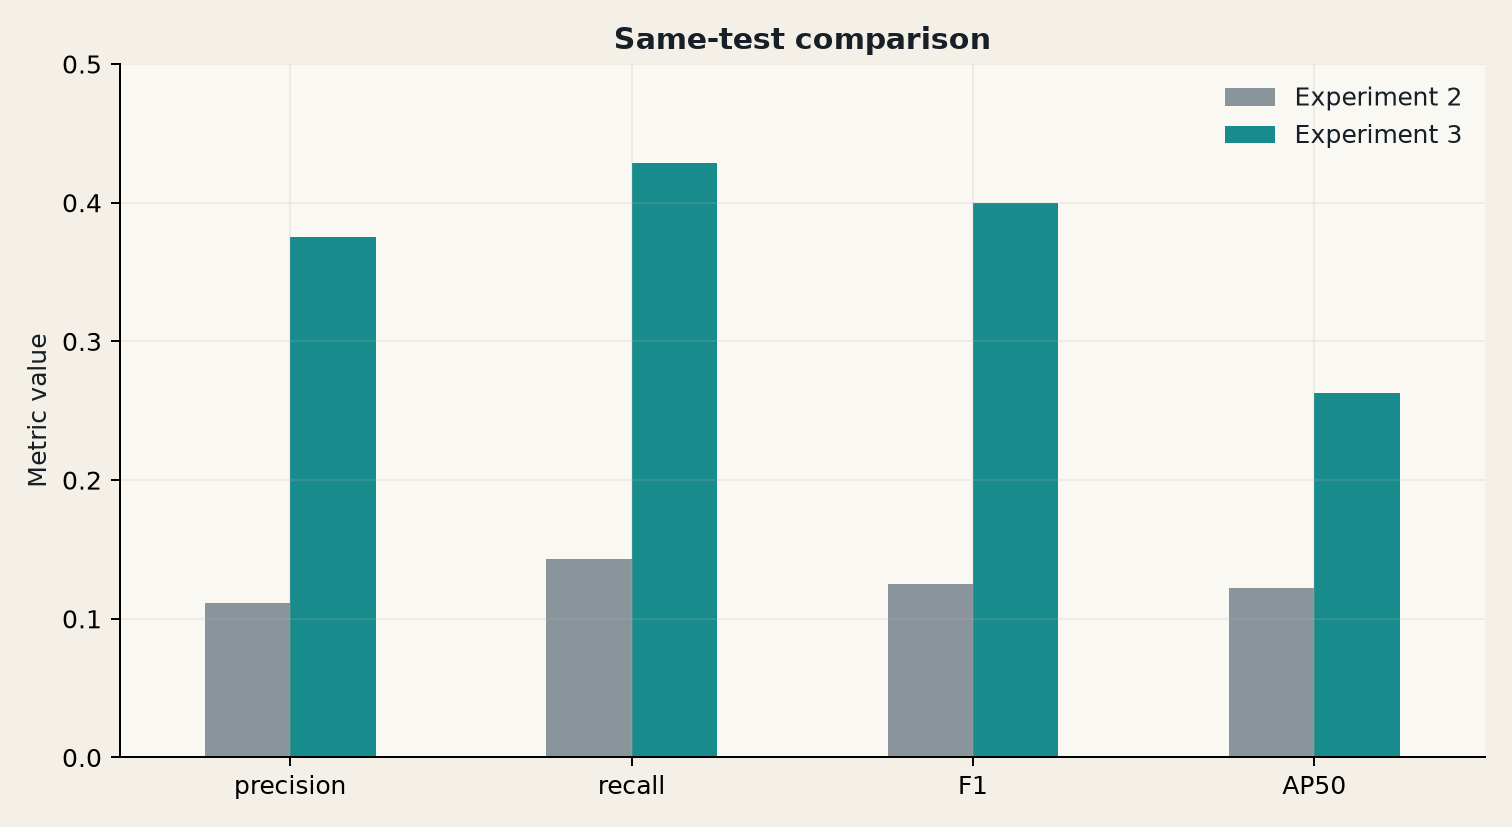
Experiment 2 and Experiment 3 use the same frozen test split.
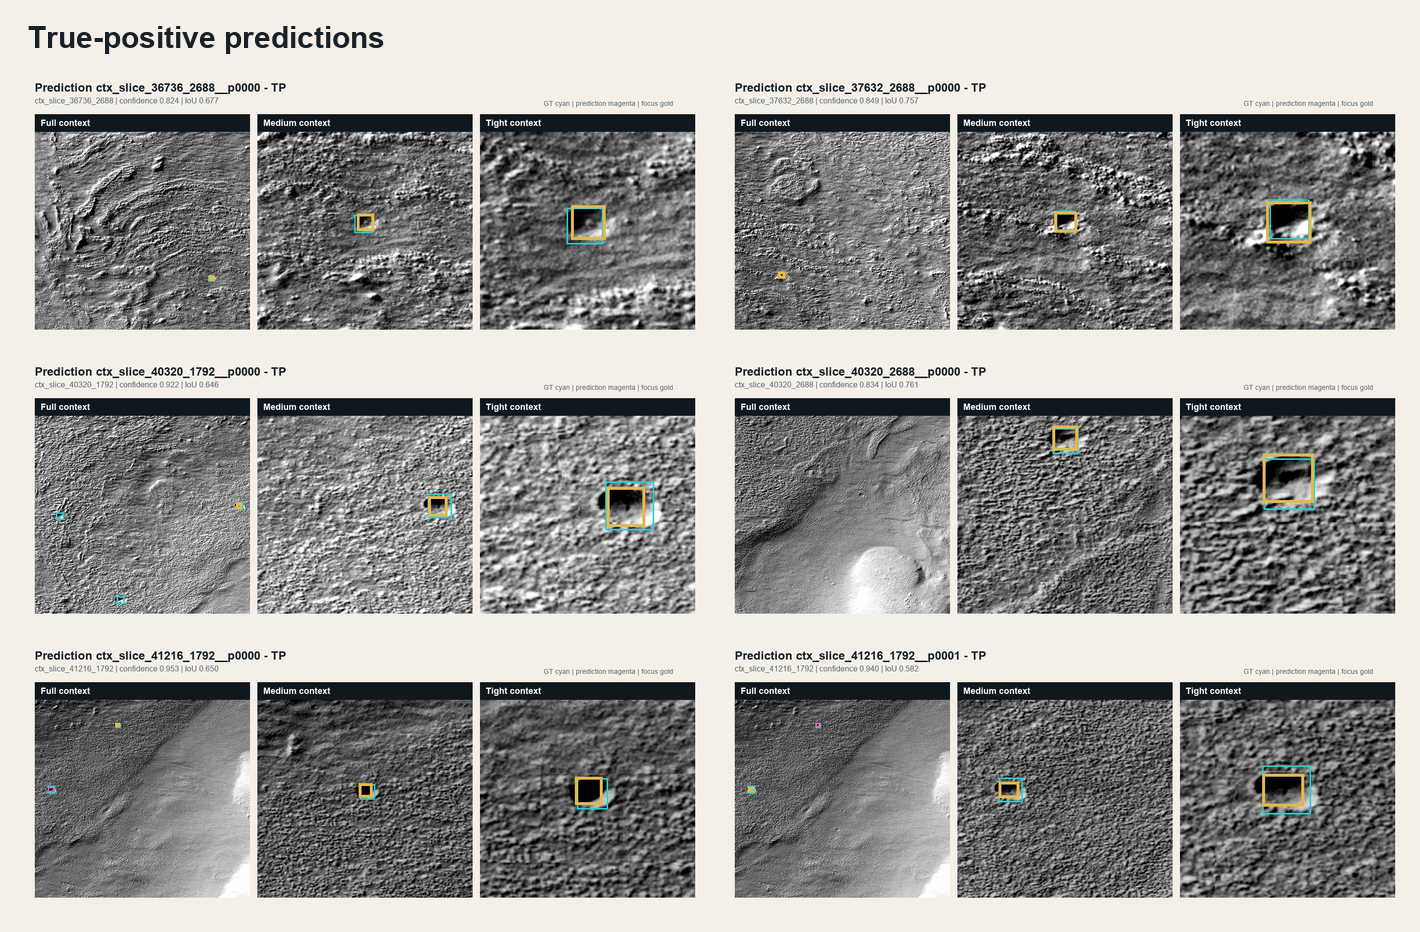
Experiment 3 true-positive examples from the saved test gallery.
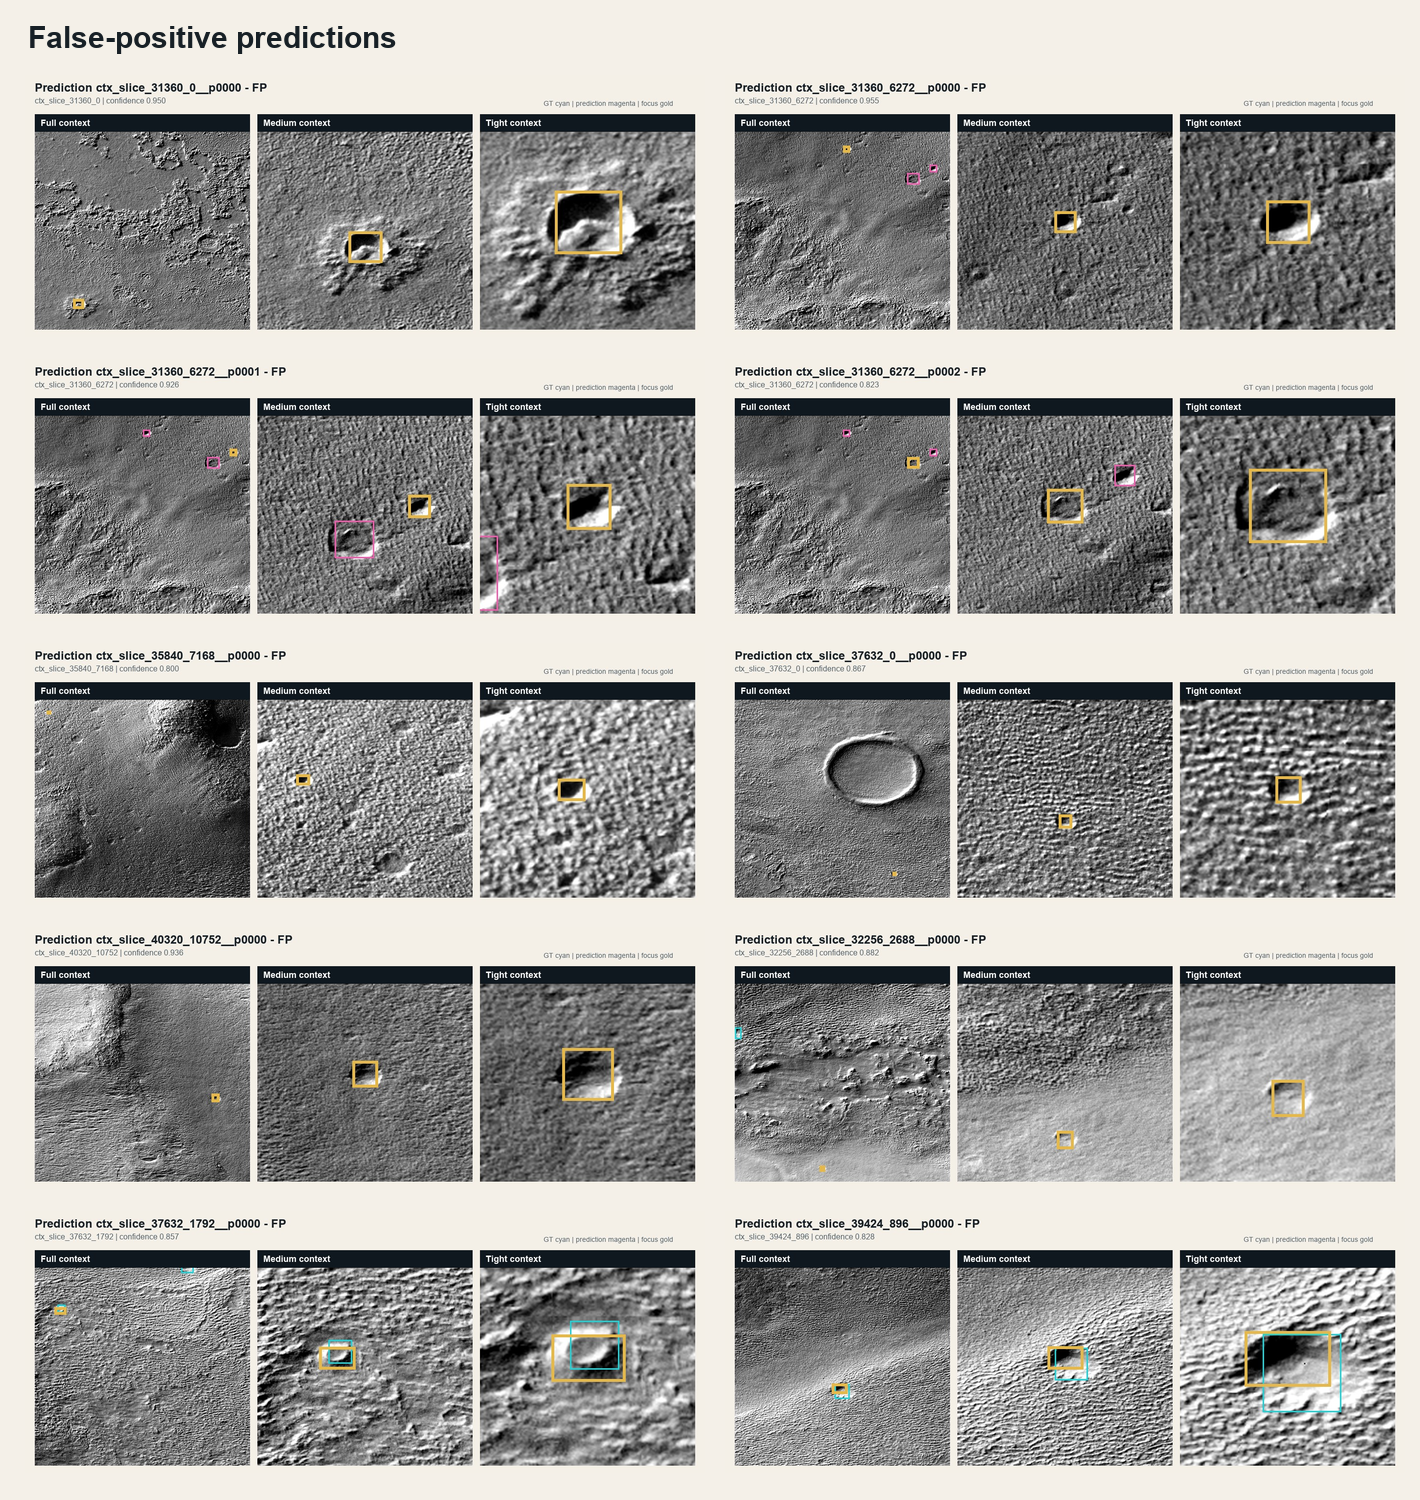
Terrain detections that did not match catalog labels.
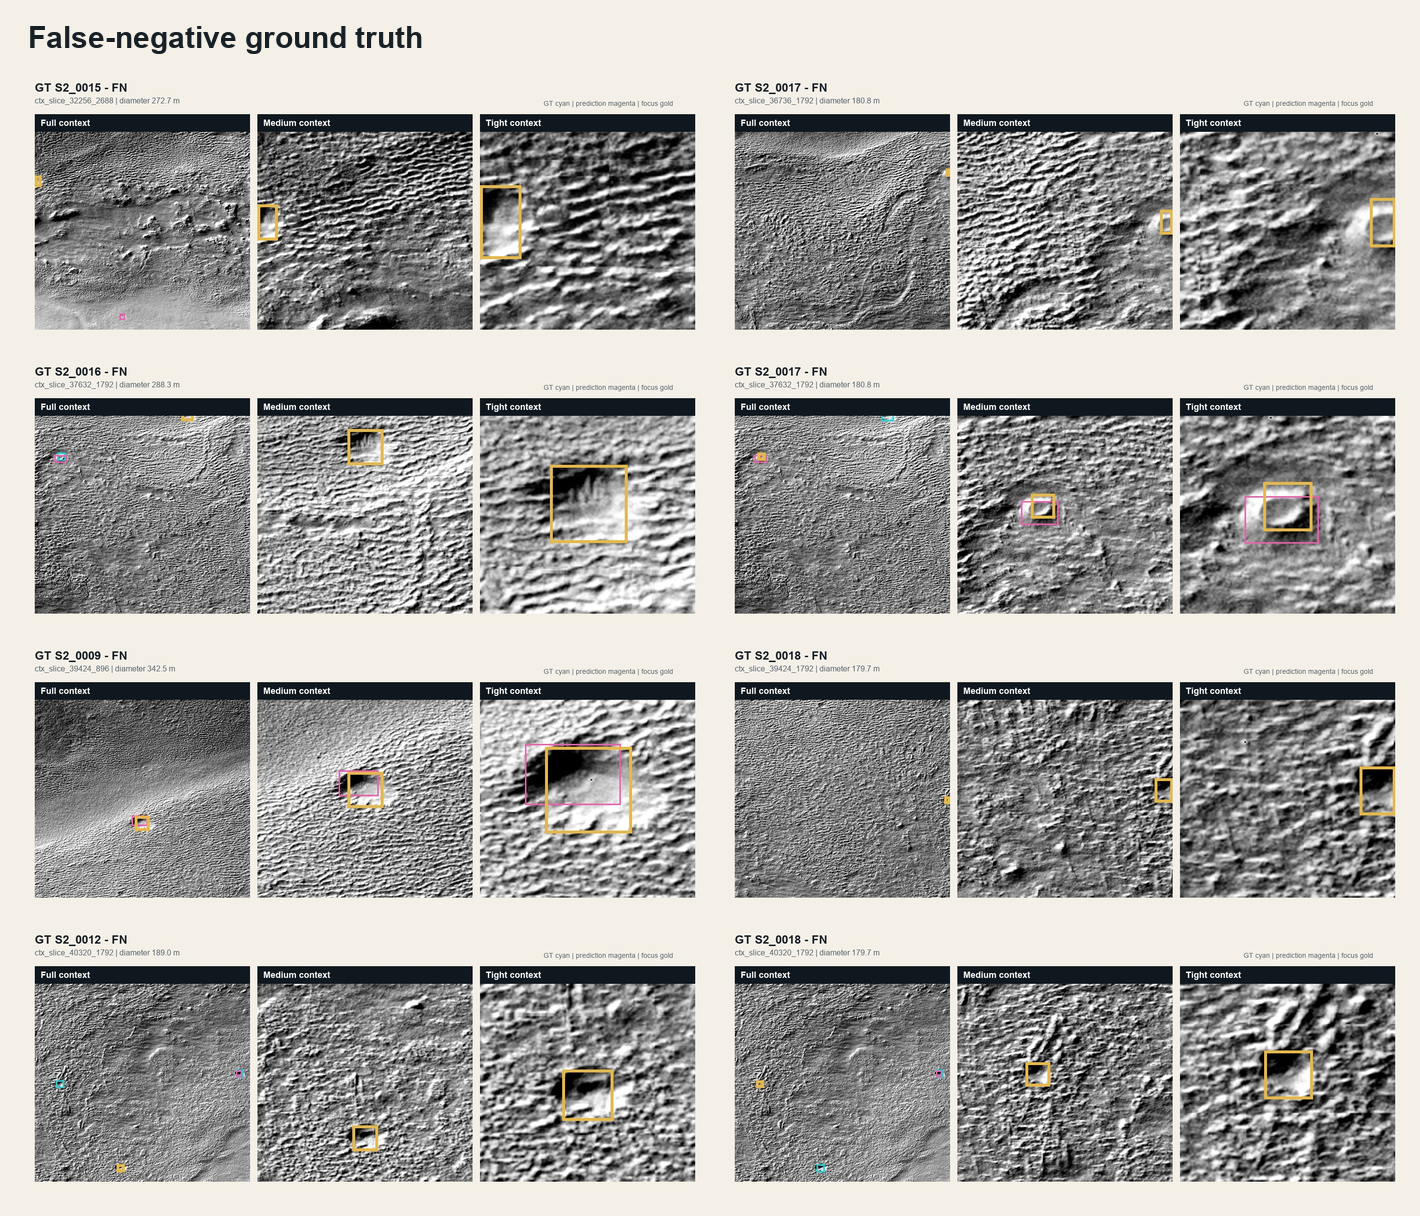
Catalog craters missed at the locked operating threshold.
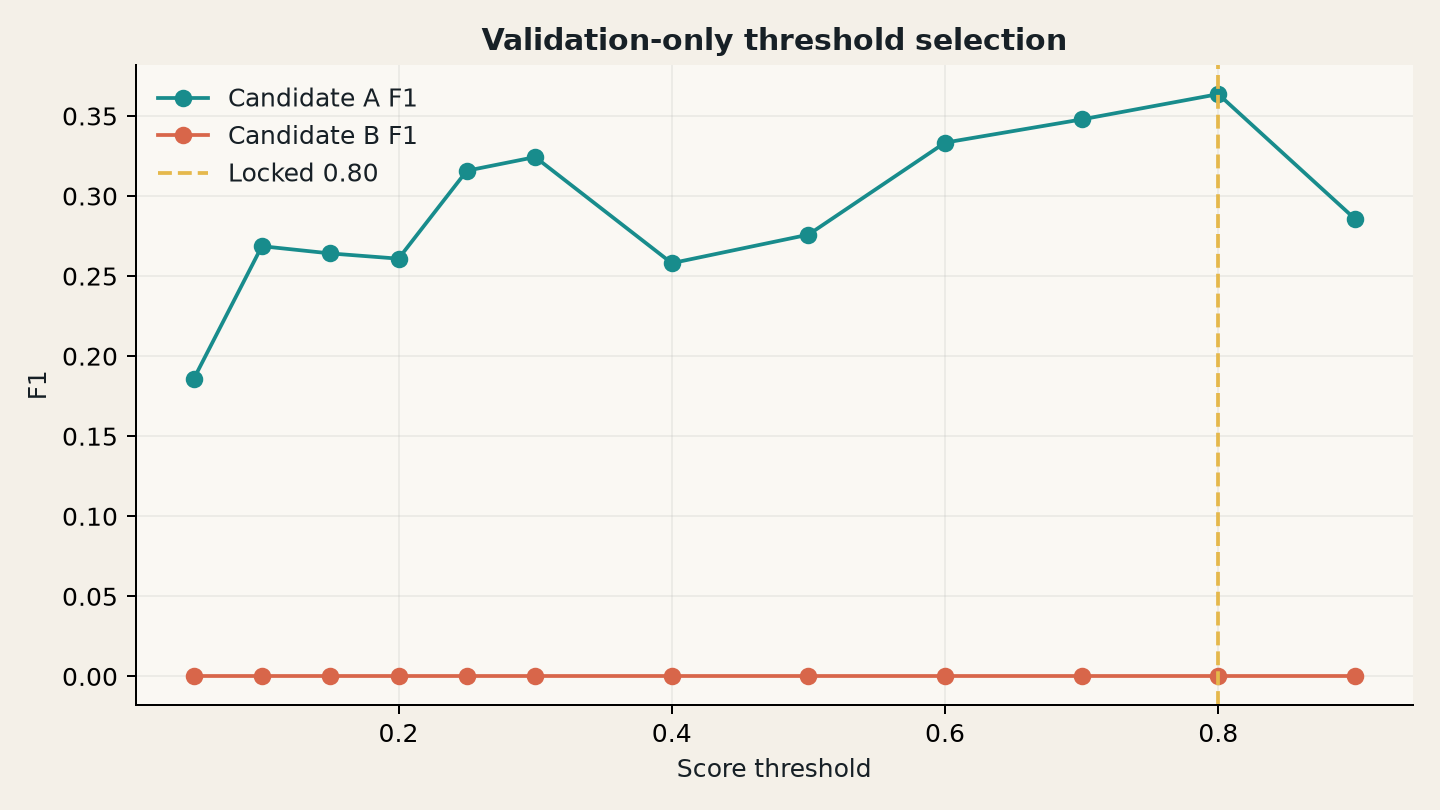
Validation threshold sweep; the chosen score cutoff was 0.80.
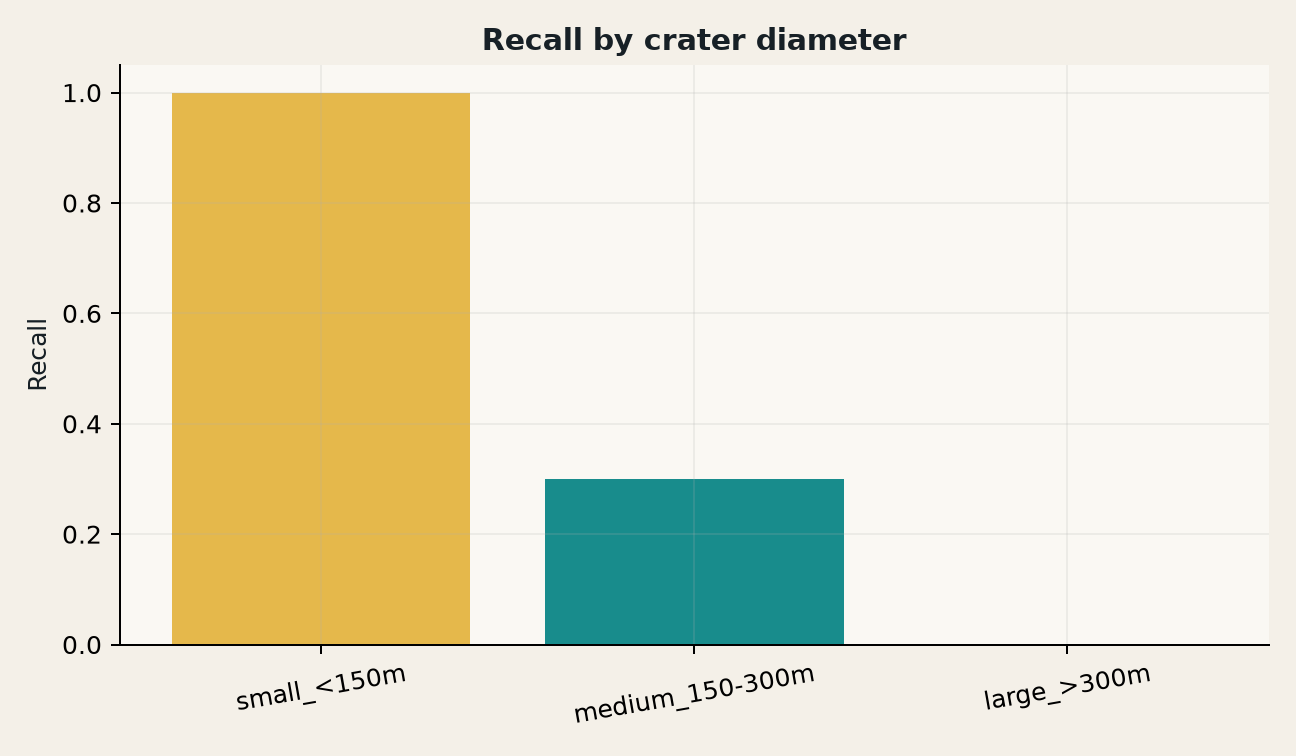
Saved size-dependent recall analysis; small sample sizes limit interpretation.
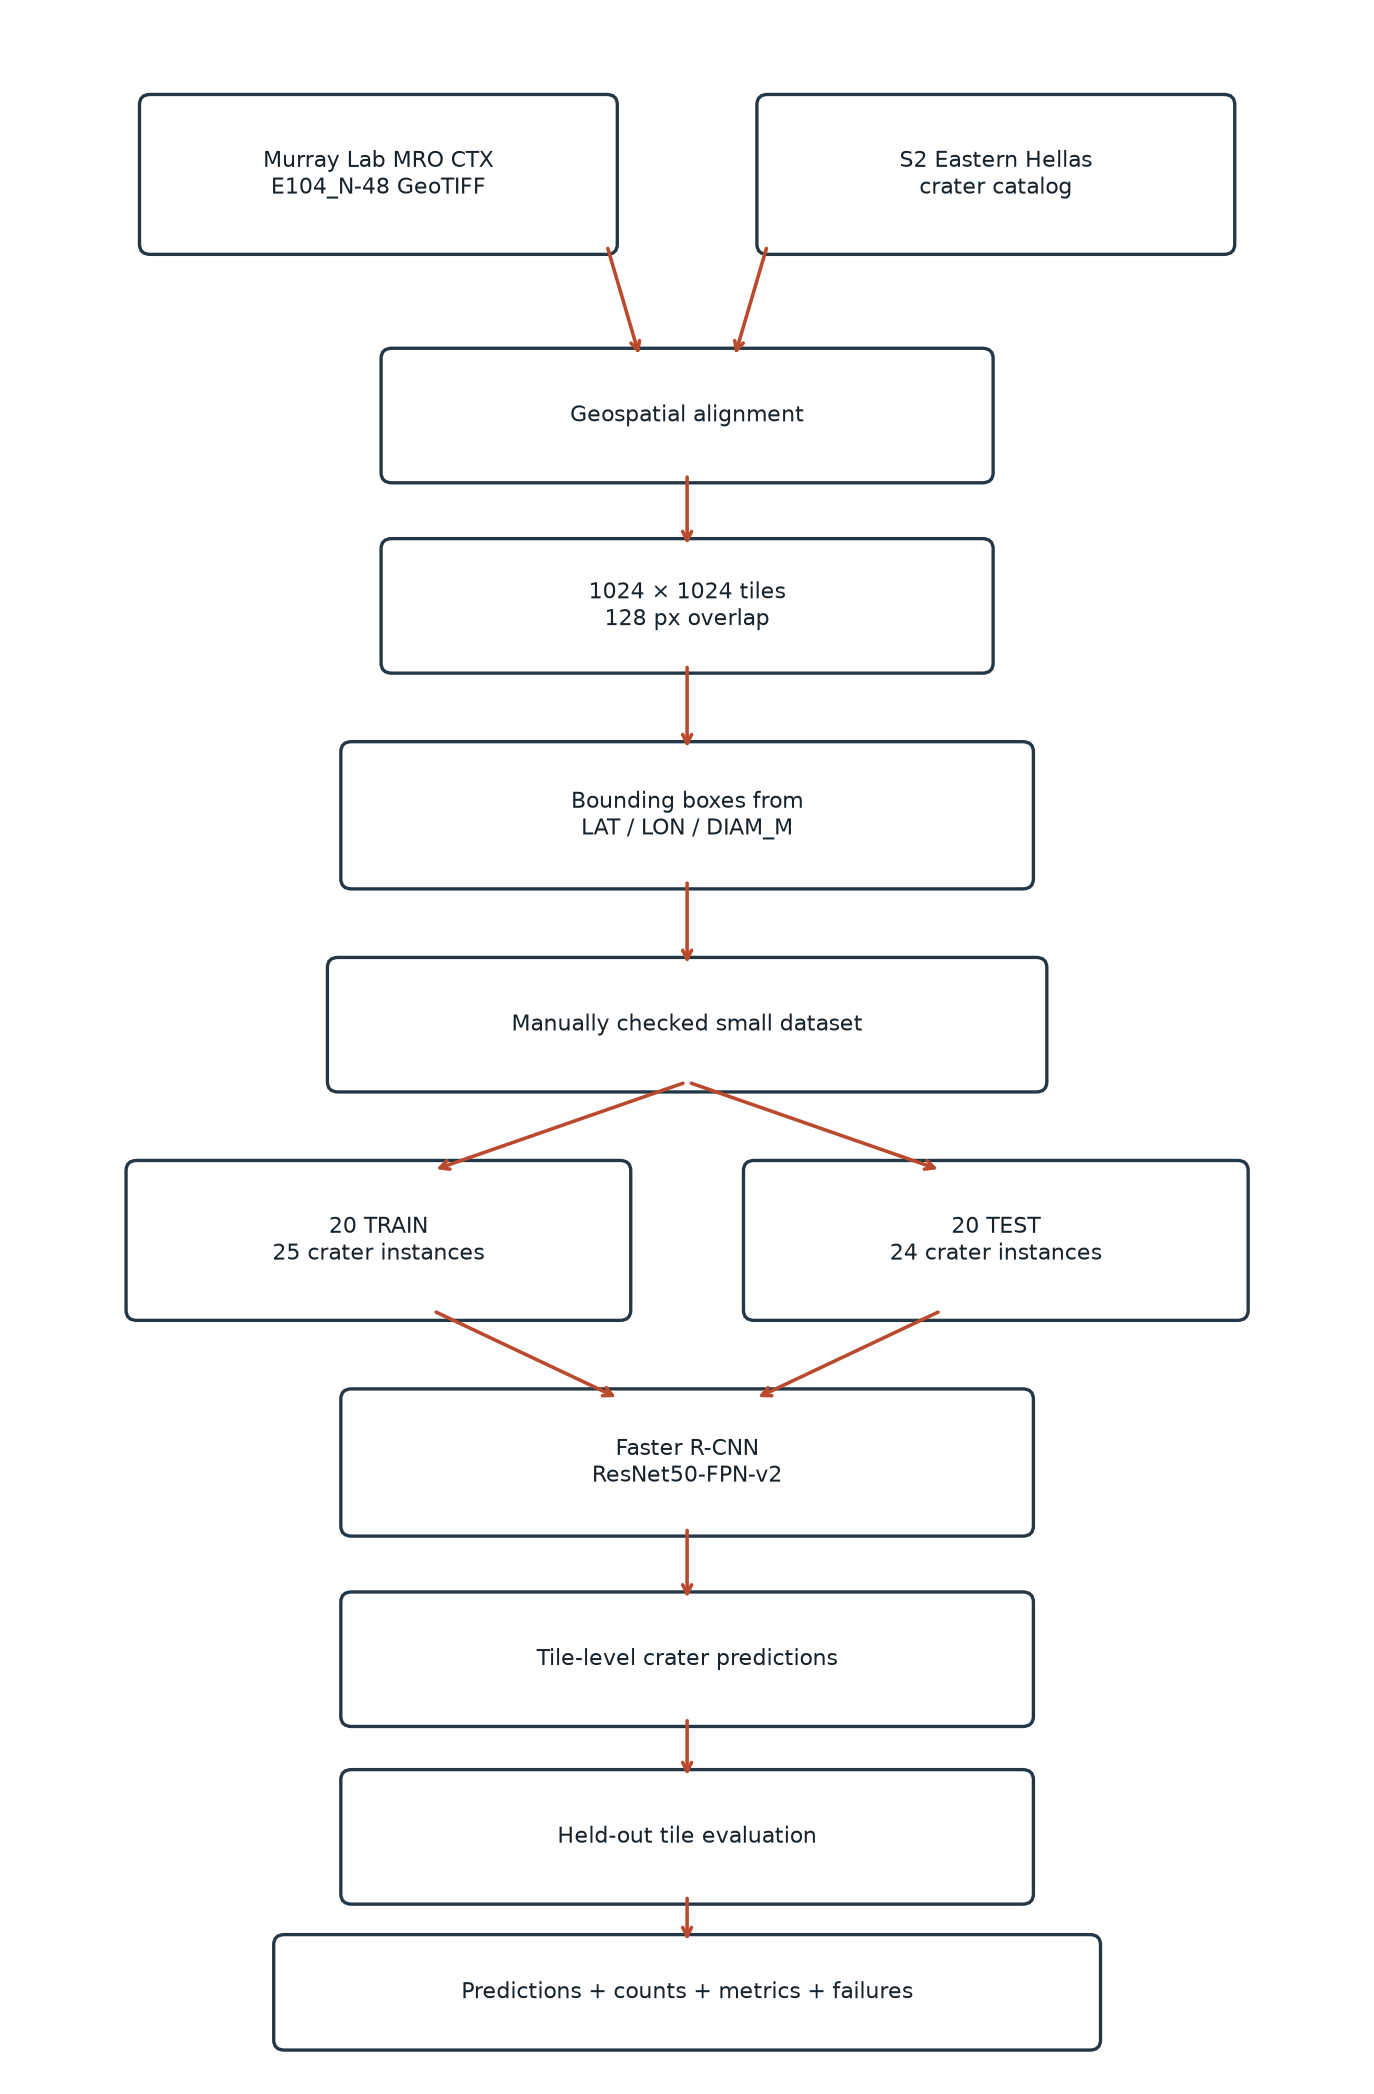
Historical 20-train / 20-test baseline. Later experiments use 150 / 25 / 25 splits.
Method, step by step
From images to evidence.
- 01
Source & align
CTX mosaic + S2 crater catalog; align map coordinates.
- 02
Tile & label
1024 × 1024 crops; crater coordinates and diameters become boxes.
- 03
Freeze splits
150 train / 25 validation / 25 test; no shared crater IDs or footprint overlaps.
- 04
Train candidates
Compare two candidates within the same Faster R-CNN family.
- 05
Lock on validation
Candidate A, epoch 11; score threshold 0.80 chosen before test inference.
- 06
Evaluate once
IoU 0.50; inspect precision, recall, AP50, diameter effects and failures.
Evidence, explained
What changed on the same test set?
Same 25 test images and IoU 0.50. Each system uses its own selected confidence cutoff: 0.50 for Experiment 2 and 0.80 for Experiment 3.
Precision asks how many detections were correct; recall asks how many catalog craters were recovered. F1 balances both. AP50 summarizes the precision–recall ranking at IoU 0.50. Higher scores here do not establish performance on another region.
Evidence, explained
Inside the learning algorithm.
The shared model family stays fixed while sampling, augmentation and candidate settings are controlled.
| Component | Implementation |
|---|---|
| Backbone | ResNet-50 with a feature pyramid; COCO initialization; crater/background head |
| Candidate A | Default torchvision resize and anchors |
| Candidate B | 1024 px transform; custom nine-anchor RPN; no validation detections before early stop |
| Balanced batches | 4 tiles: 2 positive and 2 negative; 38 candidate steps per epoch |
| Augmentation | Horizontal/vertical flips, quarter turns, contrast and gamma variation |
| Optimization | SGD, learning rate 0.002, momentum 0.9, weight decay 0.0005; warmup then cosine schedule |
| Selection | Validation AP50 chooses model; validation F1 chooses cutoff; explicit tie-break rules |
| Final fit | Reinitialize chosen model; train on 175 train+validation images for 11 locked epochs |
| Evaluation | One-to-one matching at IoU 0.50; test accessed after locking model and threshold |
Evidence, explained
Every test tile counts.
The saved per-tile table includes empty and crater-containing tiles; aggregate scores alone can hide terrain false positives.
Inspect all 25 test-tile records
| tile_id | TP | FP | FN | precision | recall | F1 |
|---|---|---|---|---|---|---|
| ctx_slice_31360_0 | 0 | 1 | 0 | 0.0 | 0.0 | 0.0 |
| ctx_slice_31360_6272 | 0 | 3 | 0 | 0.0 | 0.0 | 0.0 |
| ctx_slice_31360_10752 | 0 | 0 | 0 | 0.0 | 0.0 | 0.0 |
| ctx_slice_33152_1792 | 0 | 0 | 0 | 0.0 | 0.0 | 0.0 |
| ctx_slice_34048_8960 | 0 | 0 | 0 | 0.0 | 0.0 | 0.0 |
| ctx_slice_34048_11648 | 0 | 0 | 0 | 0.0 | 0.0 | 0.0 |
| ctx_slice_35840_7168 | 0 | 1 | 0 | 0.0 | 0.0 | 0.0 |
| ctx_slice_35840_9856 | 0 | 0 | 0 | 0.0 | 0.0 | 0.0 |
| ctx_slice_37632_0 | 0 | 1 | 0 | 0.0 | 0.0 | 0.0 |
| ctx_slice_39424_9856 | 0 | 0 | 0 | 0.0 | 0.0 | 0.0 |
| ctx_slice_40320_0 | 0 | 0 | 0 | 0.0 | 0.0 | 0.0 |
| ctx_slice_40320_8064 | 0 | 0 | 0 | 0.0 | 0.0 | 0.0 |
| ctx_slice_40320_10752 | 0 | 1 | 0 | 0.0 | 0.0 | 0.0 |
| ctx_slice_42112_4480 | 0 | 0 | 0 | 0.0 | 0.0 | 0.0 |
| ctx_slice_42112_5376 | 0 | 0 | 0 | 0.0 | 0.0 | 0.0 |
| ctx_slice_32256_2688 | 0 | 1 | 1 | 0.0 | 0.0 | 0.0 |
| ctx_slice_36736_1792 | 0 | 0 | 1 | 0.0 | 0.0 | 0.0 |
| ctx_slice_36736_2688 | 1 | 0 | 0 | 1.0 | 1.0 | 1.0 |
| ctx_slice_37632_1792 | 0 | 1 | 2 | 0.0 | 0.0 | 0.0 |
| ctx_slice_37632_2688 | 1 | 0 | 0 | 1.0 | 1.0 | 1.0 |
| ctx_slice_39424_896 | 0 | 1 | 1 | 0.0 | 0.0 | 0.0 |
| ctx_slice_39424_1792 | 0 | 0 | 1 | 0.0 | 0.0 | 0.0 |
| ctx_slice_40320_1792 | 1 | 0 | 2 | 1.0 | 0.3333333333333333 | 0.5 |
| ctx_slice_40320_2688 | 1 | 0 | 0 | 1.0 | 1.0 | 1.0 |
| ctx_slice_41216_1792 | 2 | 0 | 0 | 1.0 | 1.0 | 1.0 |
The research question
Can a crater detector turn orbital imagery into measurable, reviewable crater candidates? The work follows a CTX-to-labels-to-detector workflow, with evaluation and geospatial consistency treated as part of the system.
From baseline to controlled comparison
The original baseline used one Murray Lab CTX mosaic and a small 20-training / 20-testing tile dataset. Experiment 3 uses a byte-copied, hash-verified Experiment 2 split: 150 training, 25 validation and 25 test images. The saved handoff records zero shared crater IDs and zero cross-split footprint overlaps.
The later experiments retain the Faster R-CNN ResNet50-FPN-v2 model family and IoU = 0.50 matching definition. The original baseline diagram remains in the gallery as historical context, not as the current split.
Model selection before testing
Candidate A achieved validation AP50 0.291979 and was selected at epoch 11. Candidate B’s custom nine-anchor RPN produced no validation detections before patience stopped training. A score threshold of 0.80 was locked using validation F1 before test inference.
Saved test results
| Metric | Experiment 2 | Experiment 3 |
|---|---|---|
| Precision | 0.1111 | 0.3750 |
| Recall | 0.1429 | 0.4286 |
| F1 | 0.1250 | 0.4000 |
| AP50 | 0.1225 | 0.2631 |
| True / false positives | 2 / 16 | 6 / 10 |
| False negatives | 12 | 8 |
| Score threshold | 0.50 | 0.80 |
These are saved results on the same 25-image test split, at each experiment’s selected operating threshold. Experiment 3’s median matched IoU was 0.6632. The thresholds differ, so this is a comparison of selected systems rather than a fixed-threshold comparison.
What the failures teach
Experiment 3 still has 10 false positives and 8 missed catalog craters. Seven false positives occur on negative test tiles. The gallery includes true positives, false positives, false negatives and recall by diameter so the improvement can be assessed alongside its remaining failure modes.
Limits & next questions
This is a small, regional experiment. The saved report does not establish performance across Mars or support automated morphology claims. A stronger next test would expand geographically held-out data and inspect size-dependent misses while preserving the split and evaluation protocol.
Results here are transcribed from saved experiment artifacts; training was not rerun for this portfolio update.
Private repository · access required
Read the algorithm.
Implementation, configuration, tests and methodology.
Explore source code ↗Explore more of the work.
← Back to Selected Builds