2026 · Planetary science · Machine learning
Mars
Can a model find craters on Mars? An honest test, with the misses left in.
Explore the engineering ↓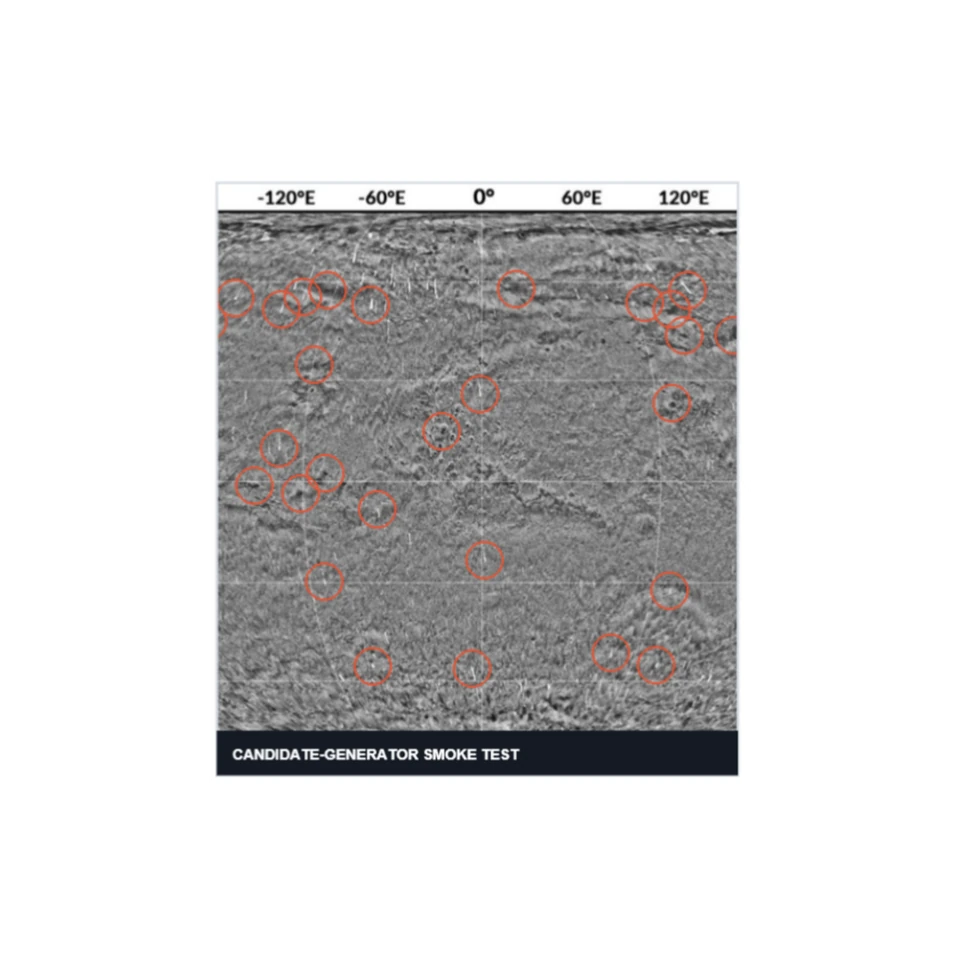
- My role
- Built the evaluation pipeline and ran the controlled experiment
- Status
- Baseline locked and tested
- Focus
- Geospatial data · ML · reproducibility
Result
On the locked test set it found 6 craters, raised 10 false alarms and missed 8 (score 0.8, IoU 0.5). AP50 is 0.263. That’s a small-data baseline, not a crater catalog.
- 01
Prepare
Map catalog craters onto 1024 px CTX image tiles.
- 02
Separate
Make sure no place or crater shows up in more than one split.
- 03
Select
Pick the model and threshold on validation data only.
- 04
Lock & test
Freeze everything, test once, keep every error.
The experiment
Inside the work.
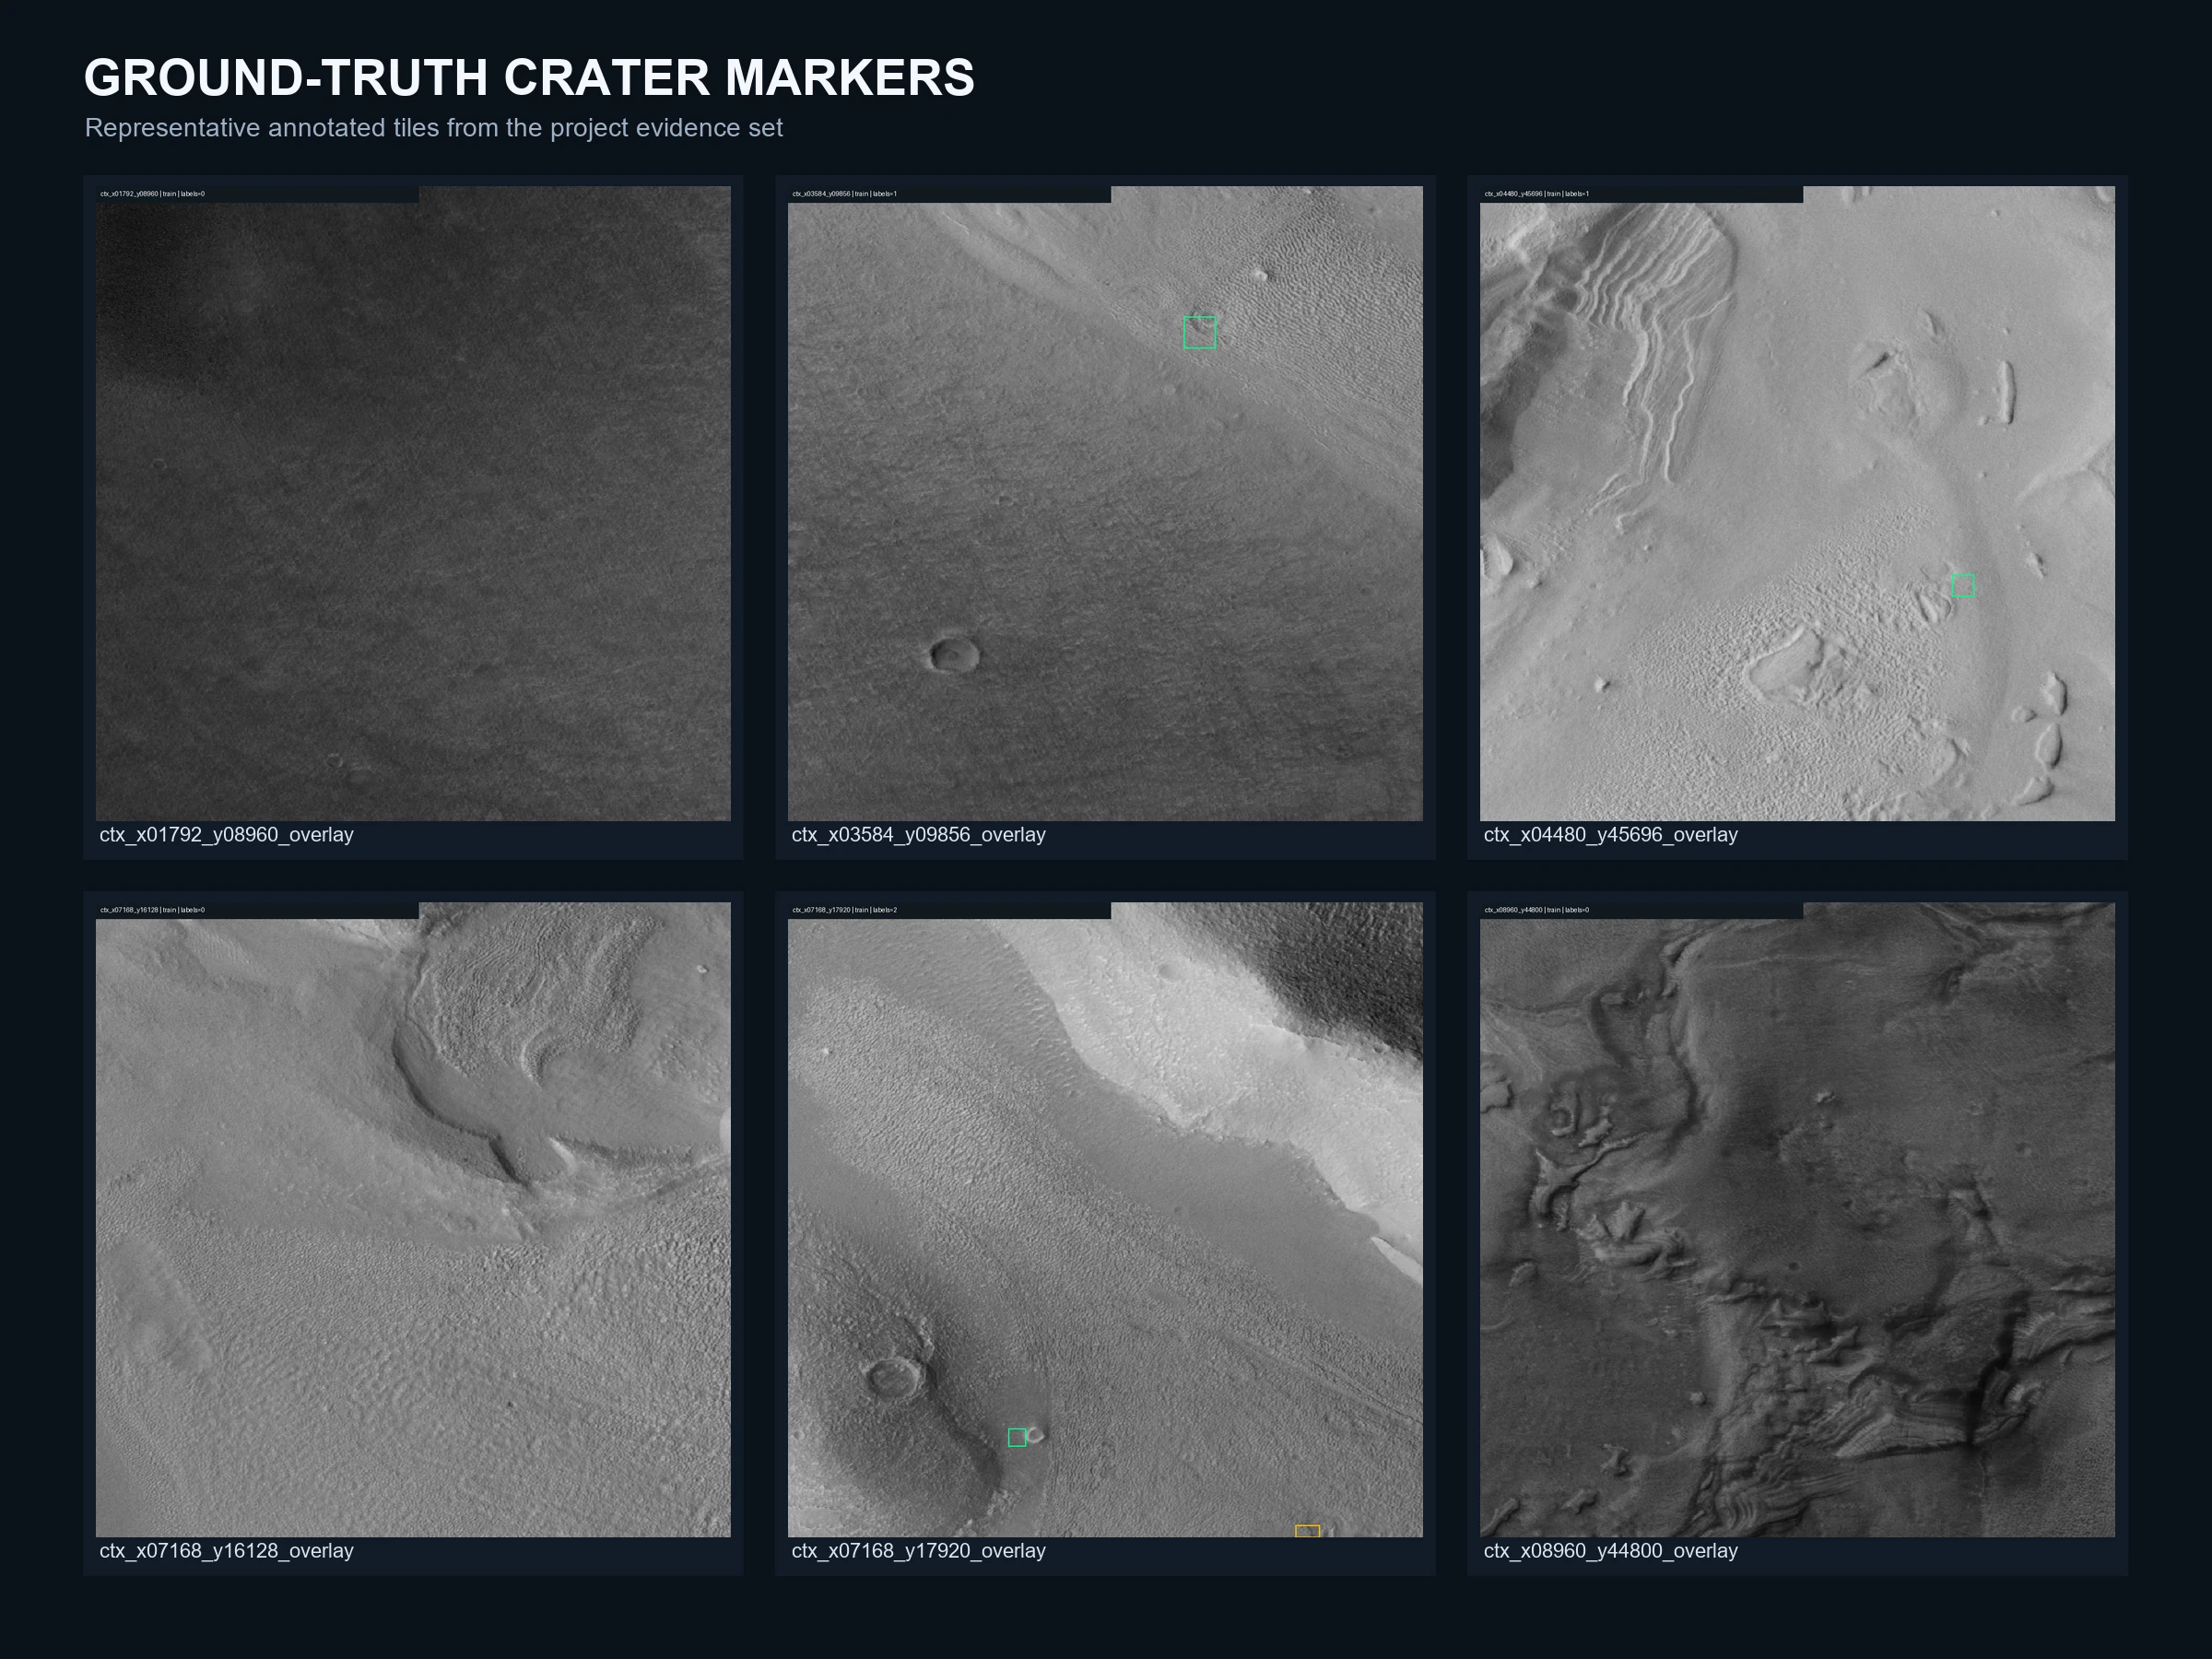
Catalog-to-tile labels provide the evaluation target; scale comes from raster metadata.
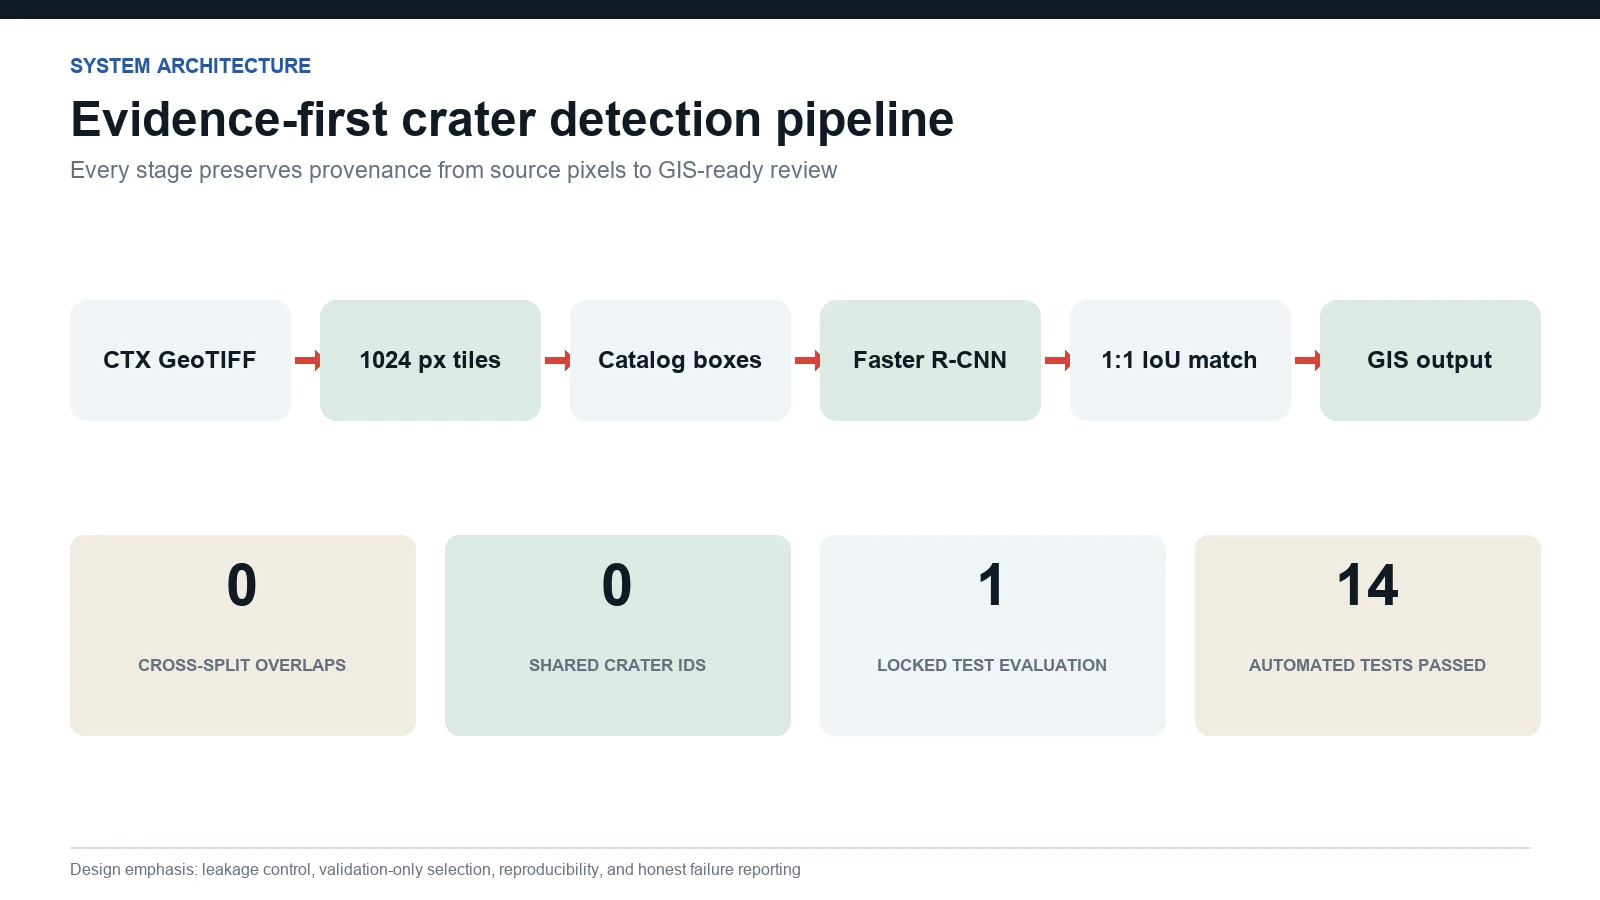
How an image tile becomes a scored detection.
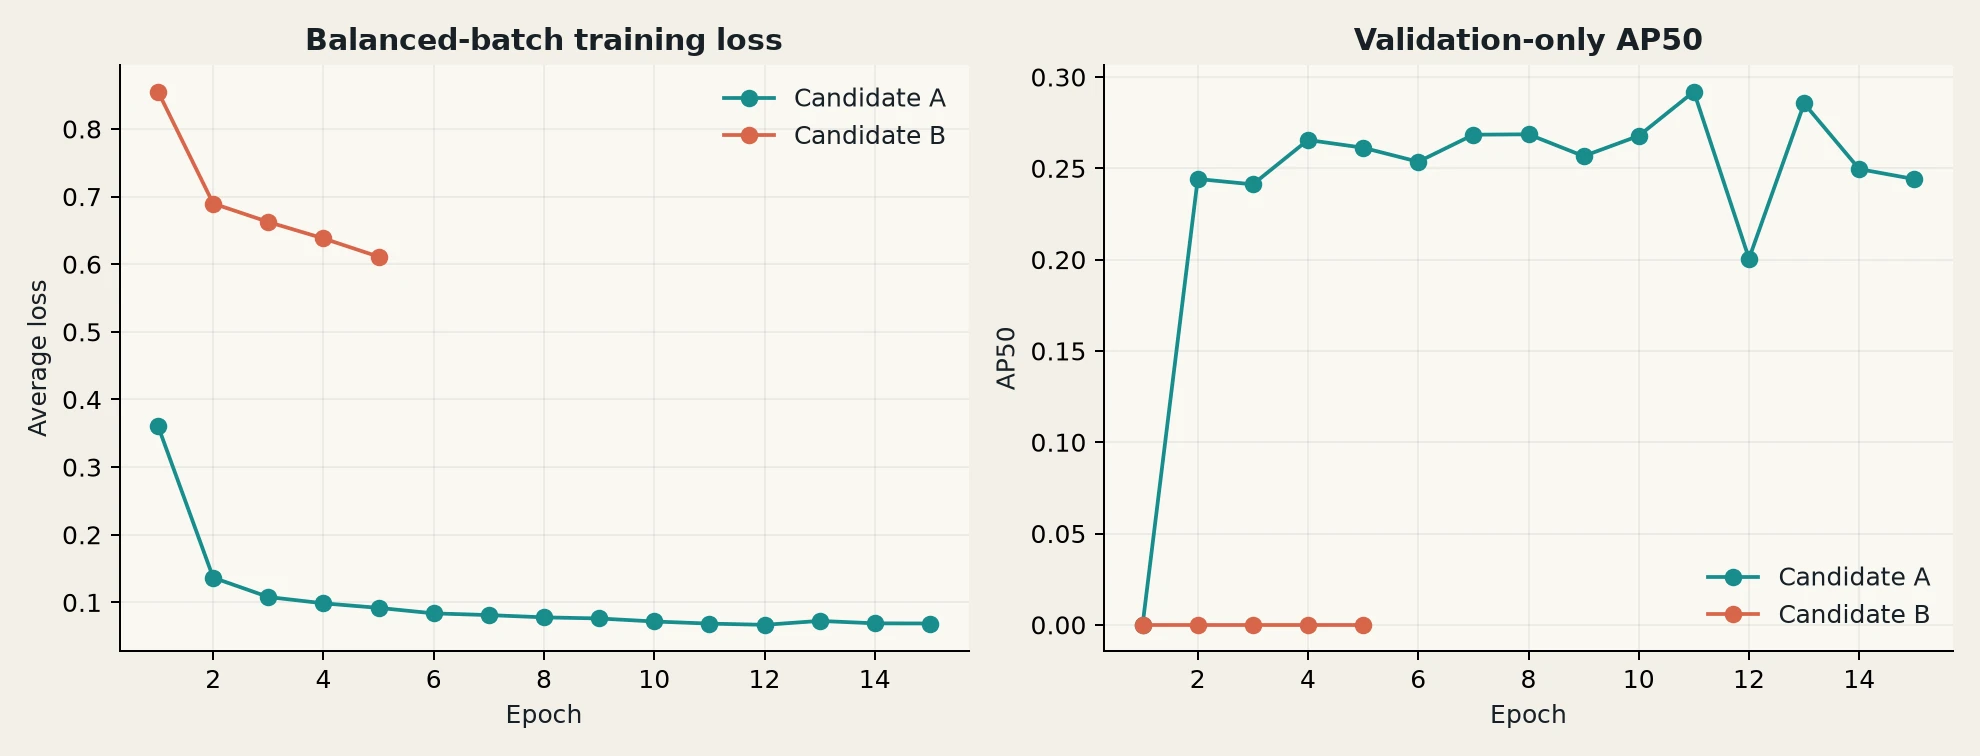
Training curves for the two model setups. Chosen on validation, never on test.
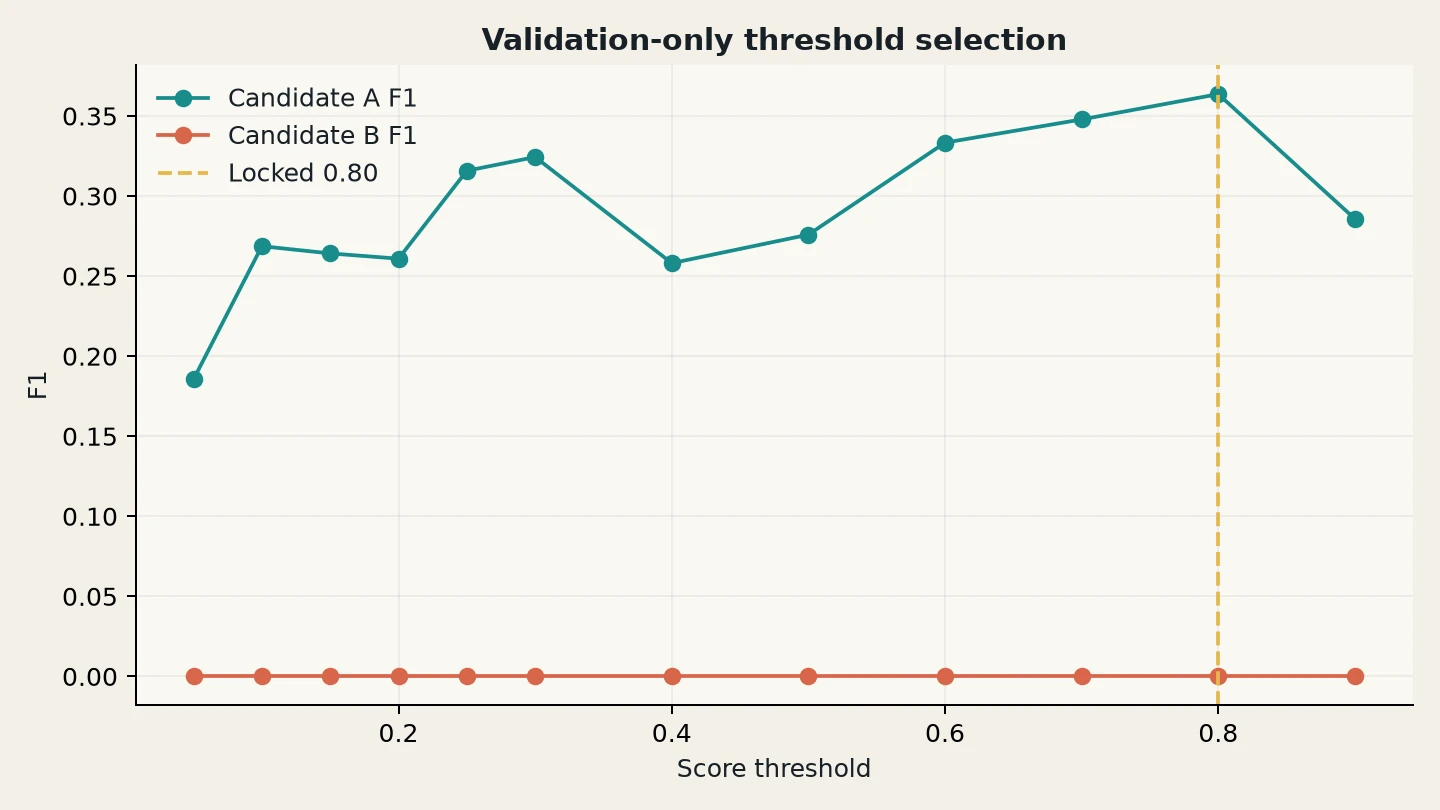
Validation-only sweep used to lock the operating threshold.
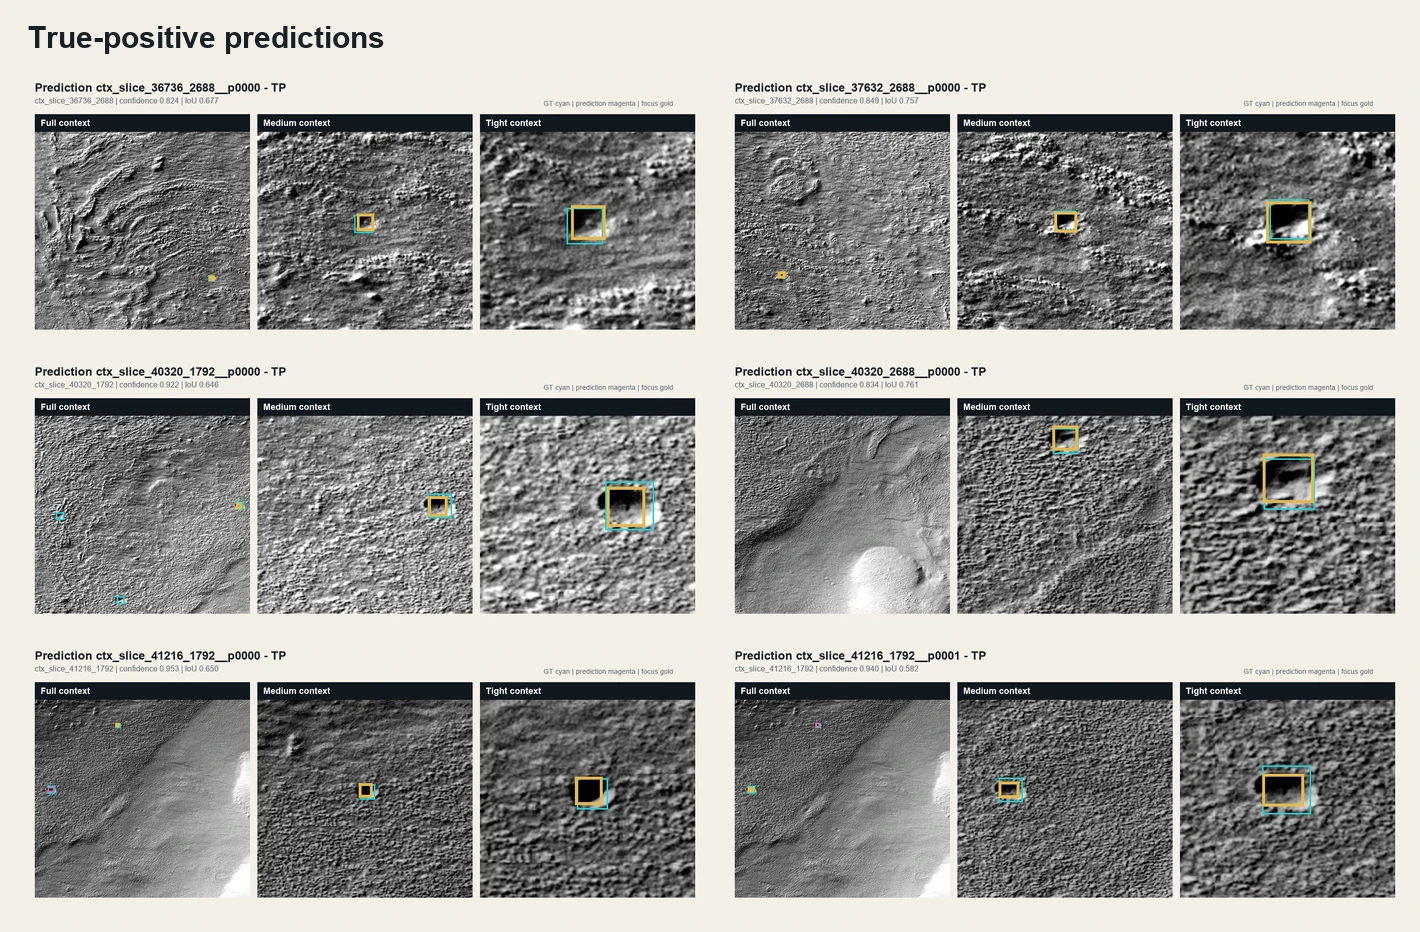
Matched detections from the locked evaluation.
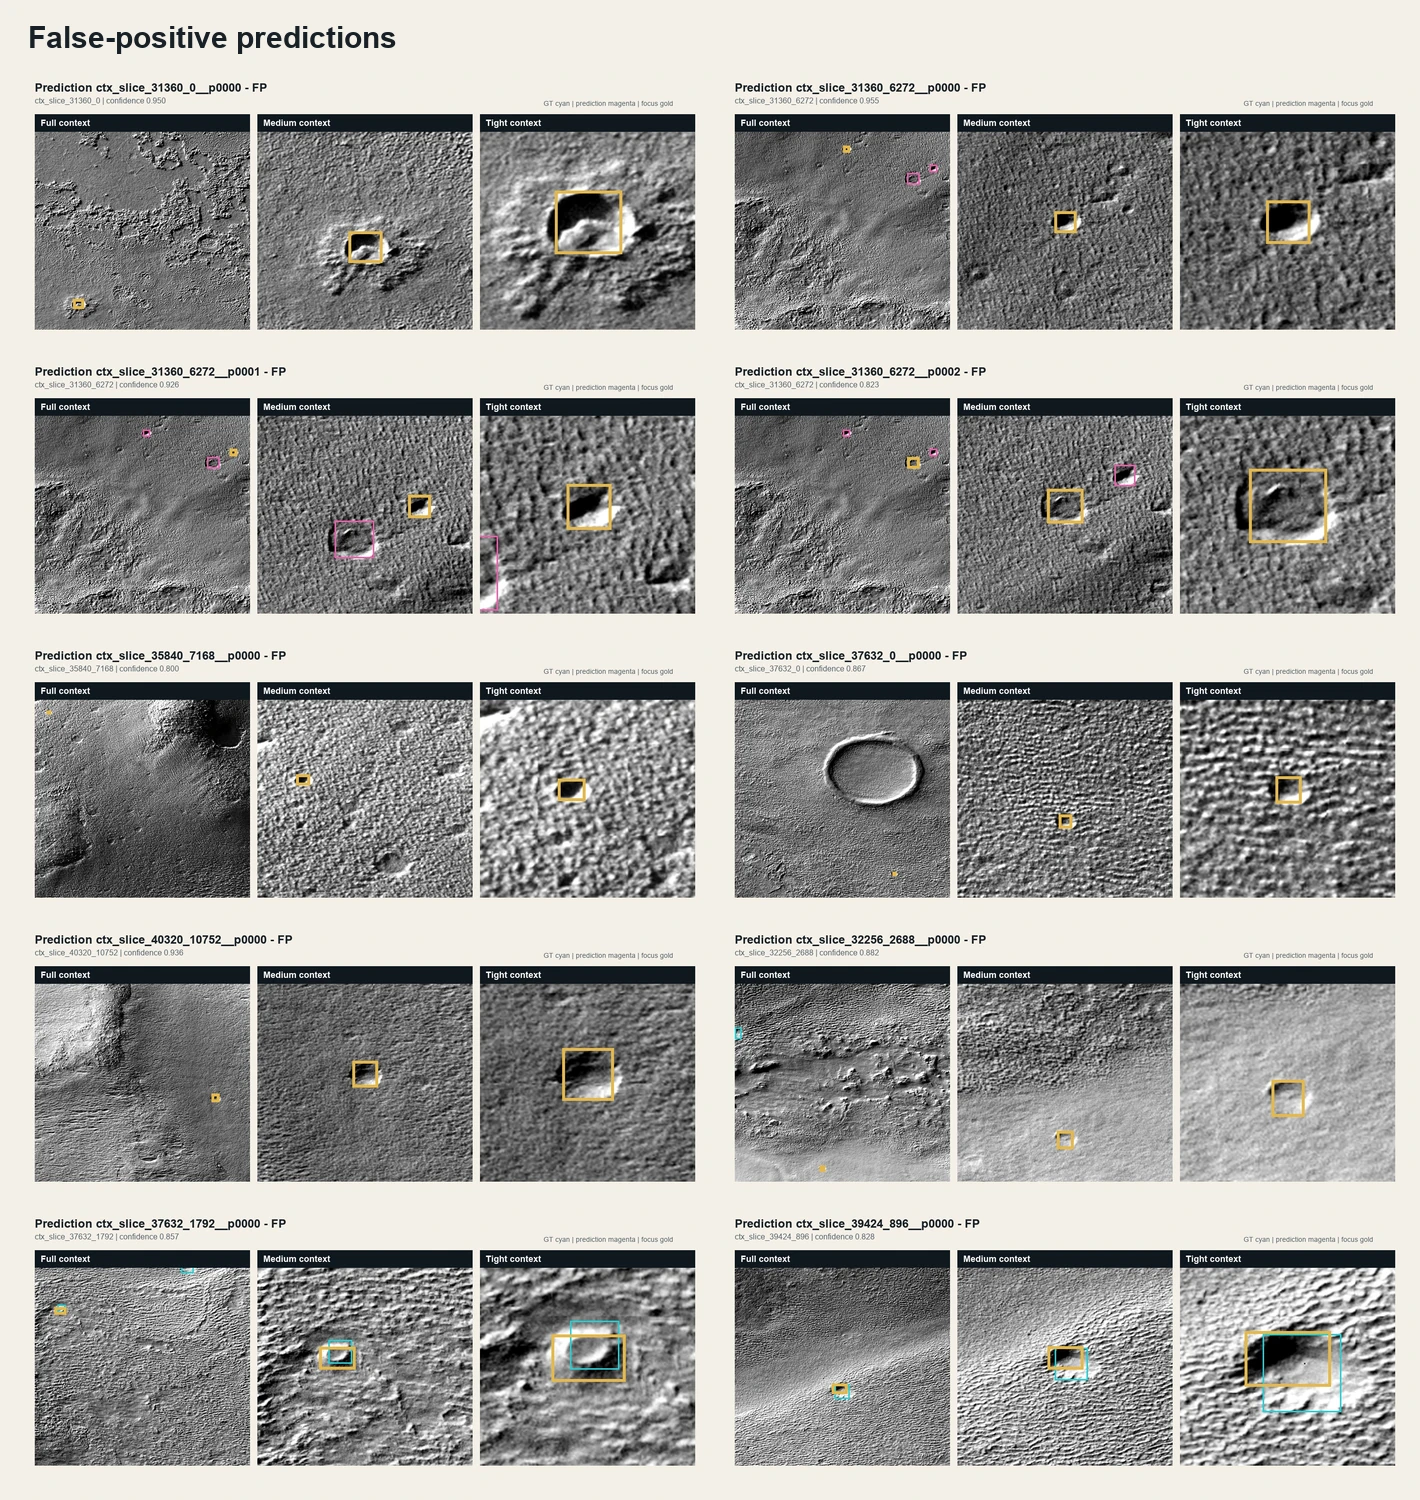
Circular-looking terrain and other false alarms remain part of the result.
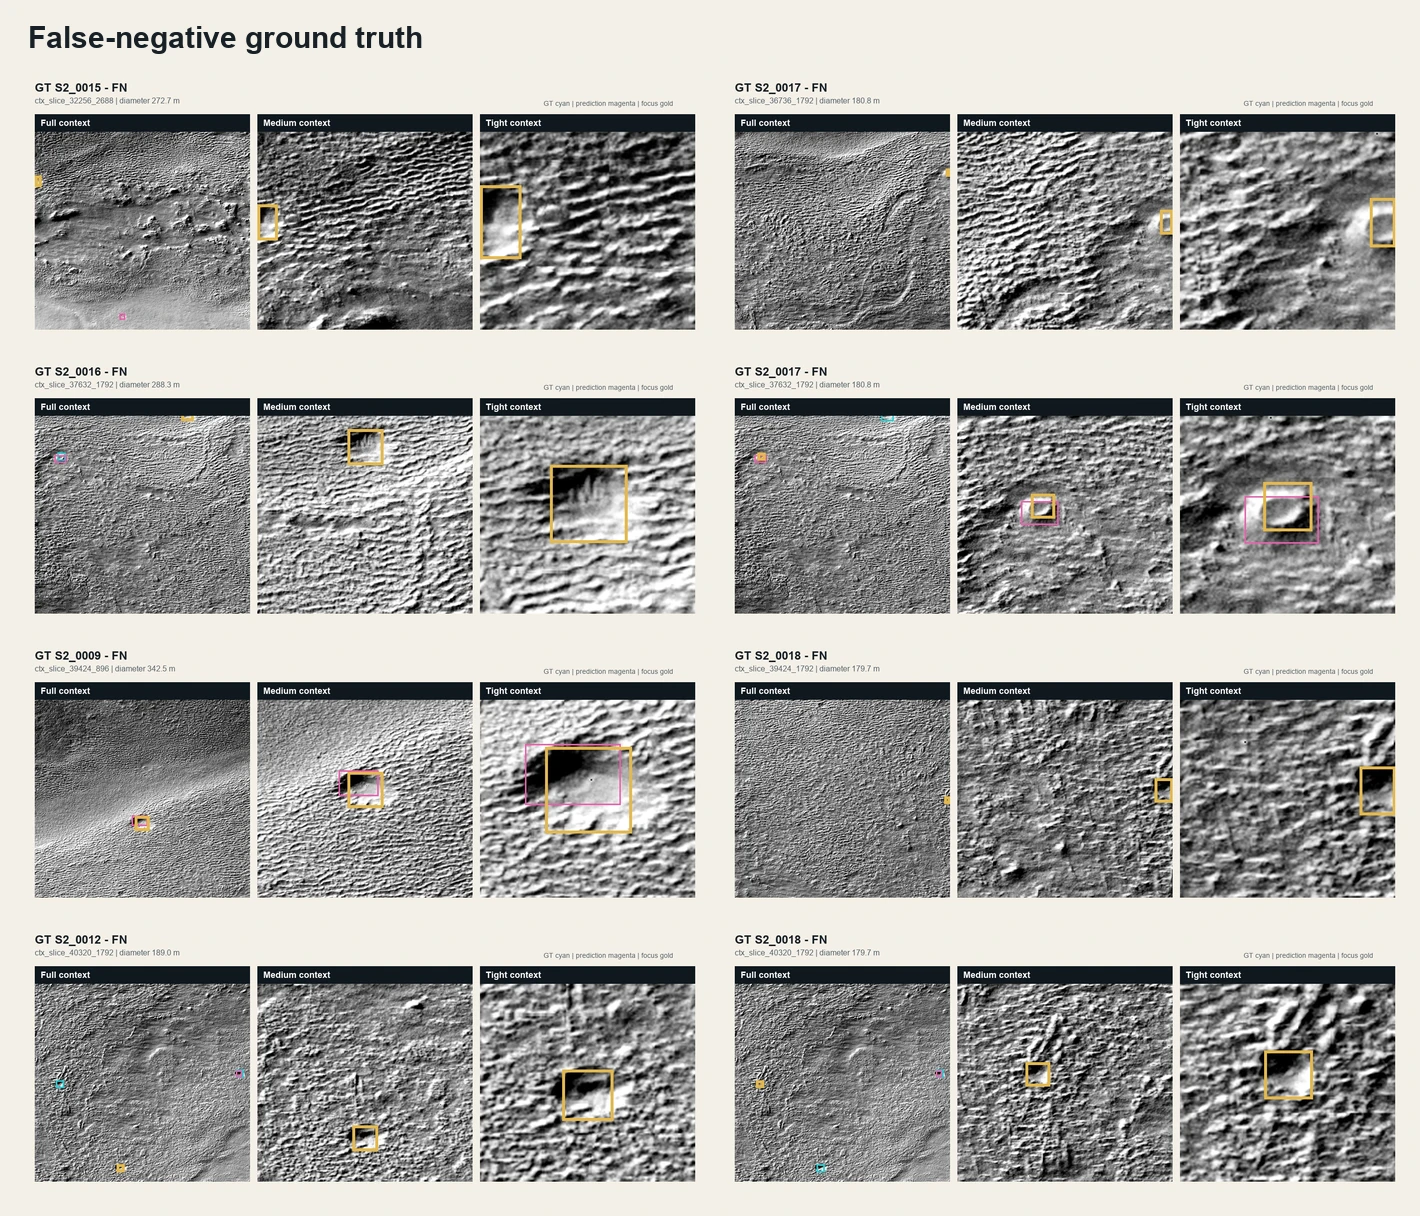
Ground-truth examples that the locked model did not recover.
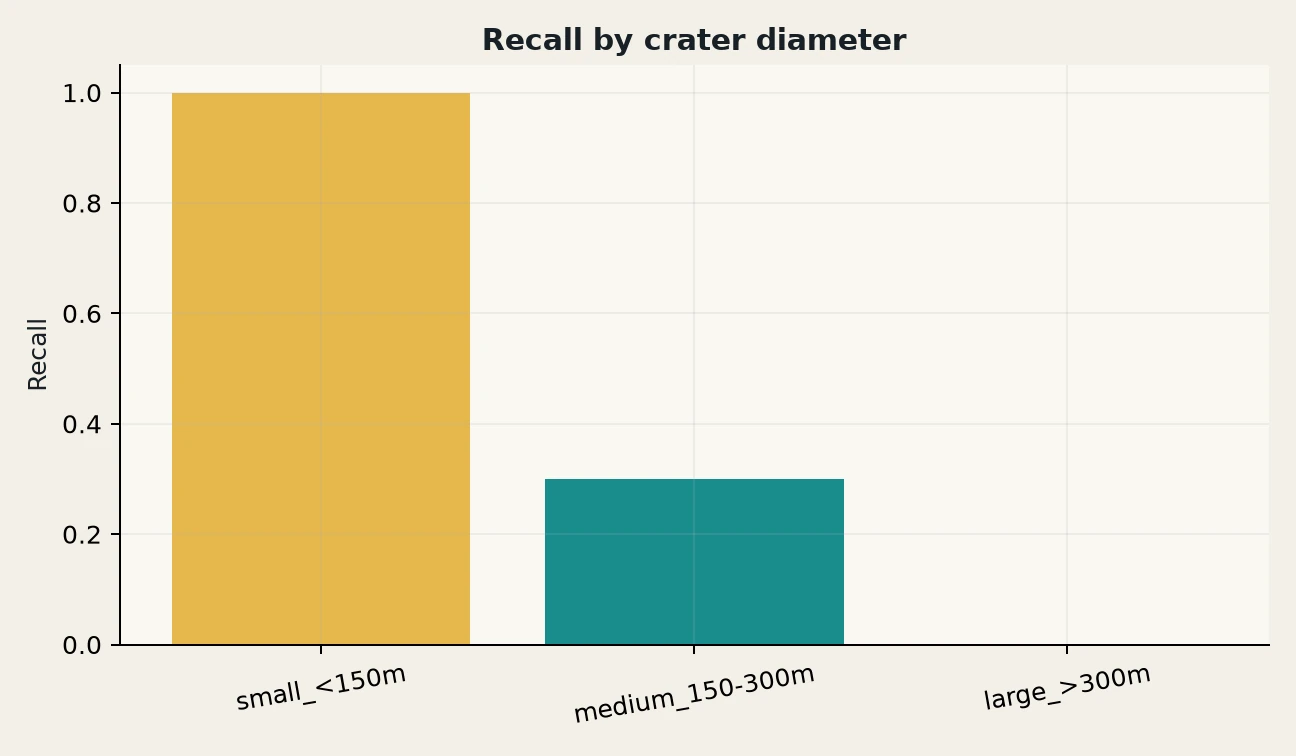
Small craters (<150 m): 3 of 3 found. Medium (150–300 m): 3 of 10. Large (>300 m): 0 of 1. Too few to read much into.
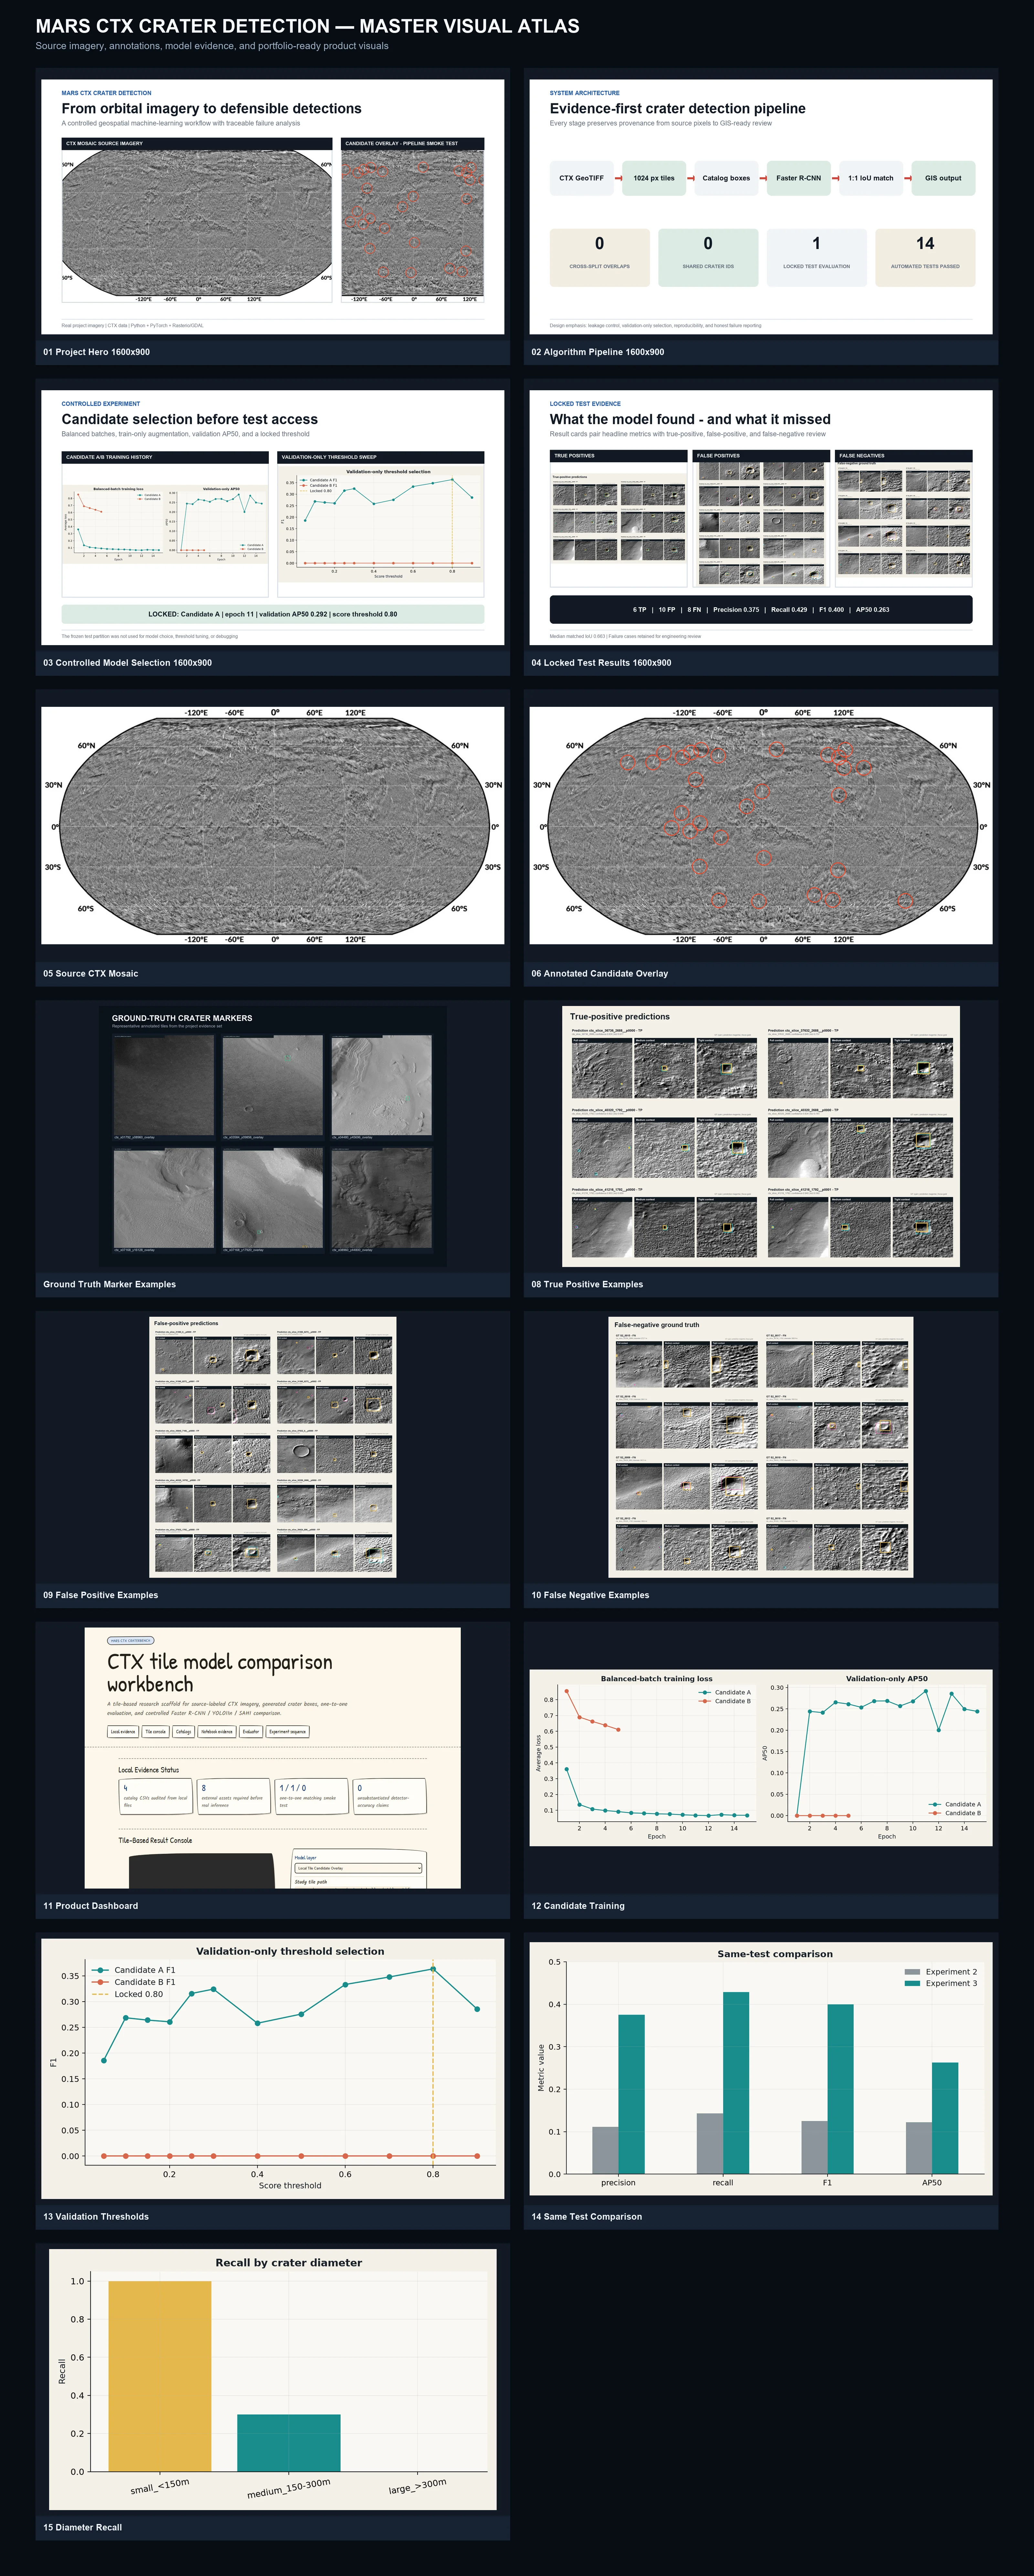
A single overview of the dataset, pipeline, evaluation, and representative errors.
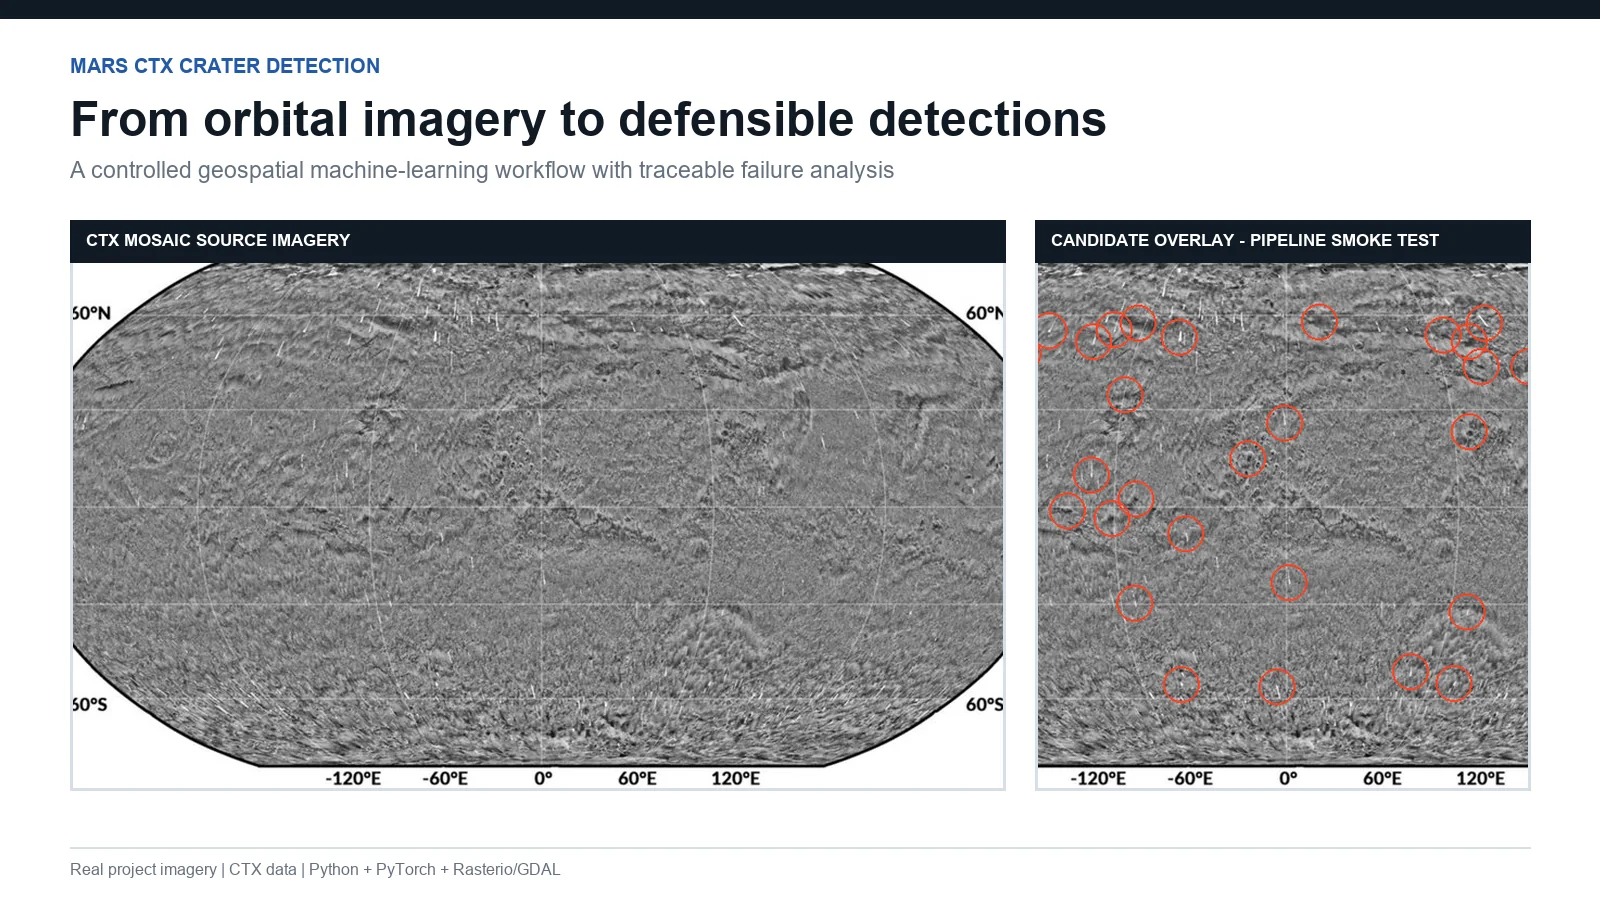
The controlled crater-detection experiment at a glance.
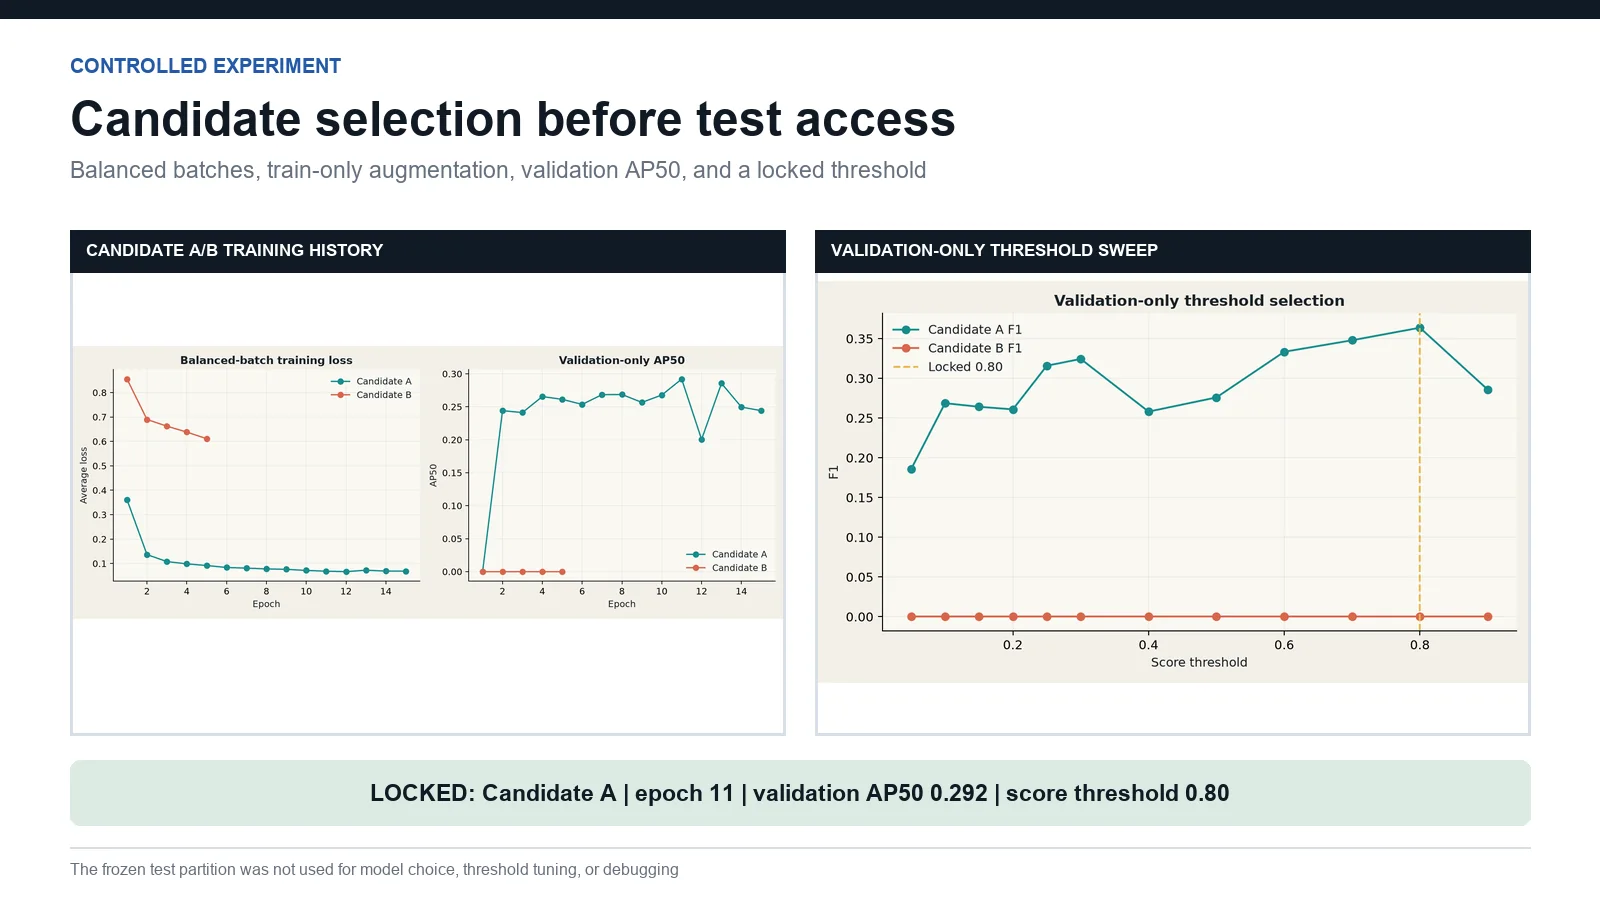
How the model was picked, as part of a controlled baseline.
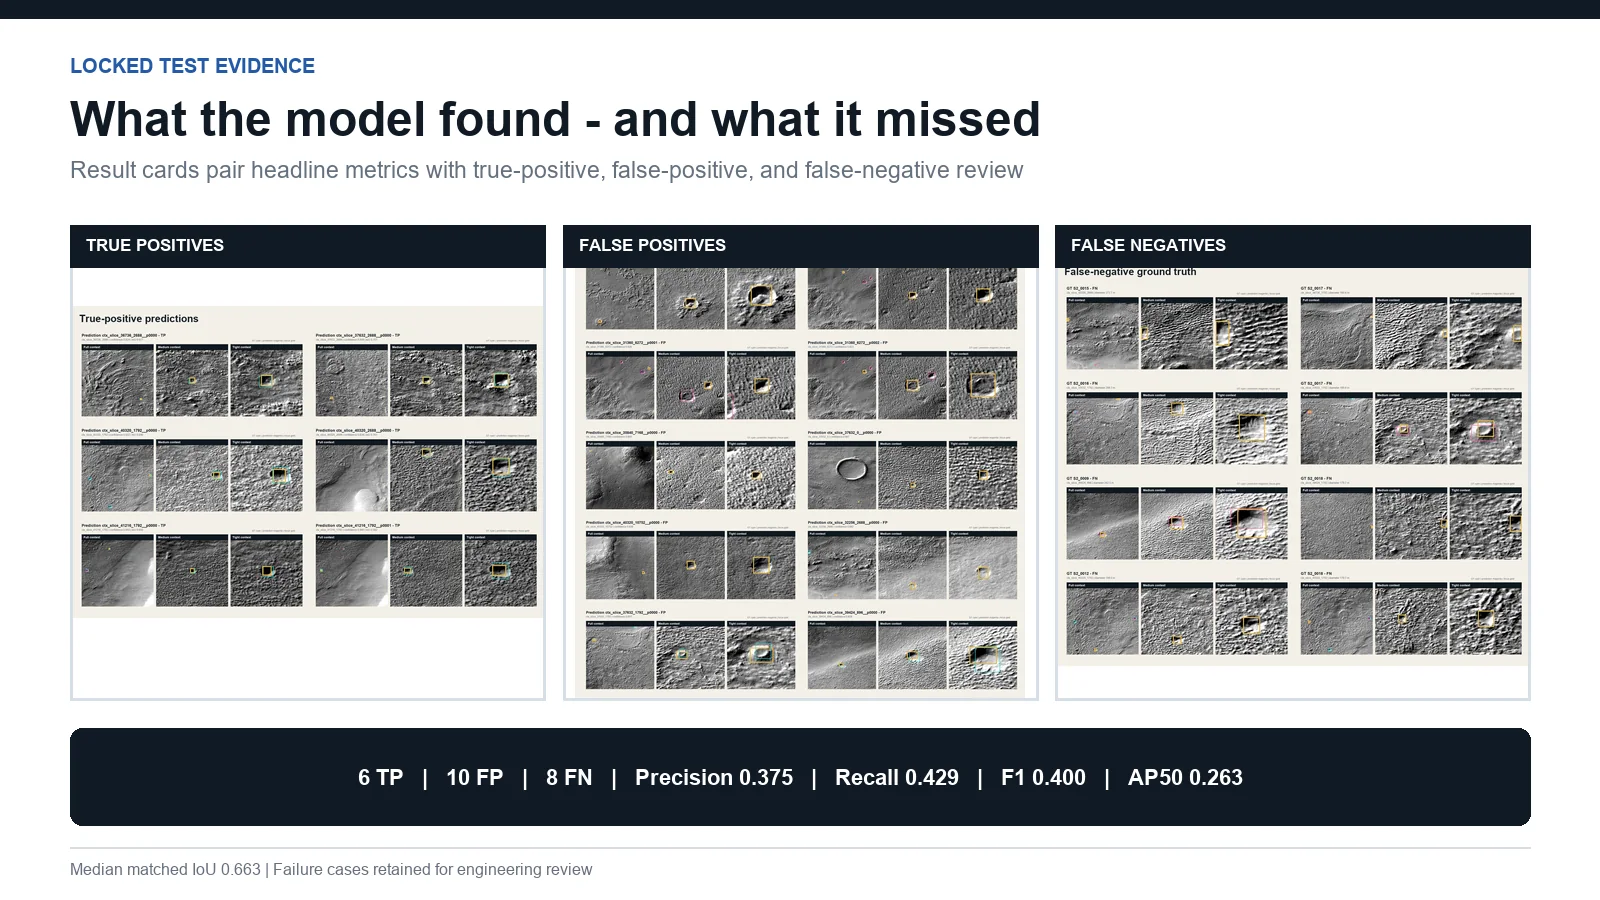
Modest precision and recall, shown exactly as they came out.
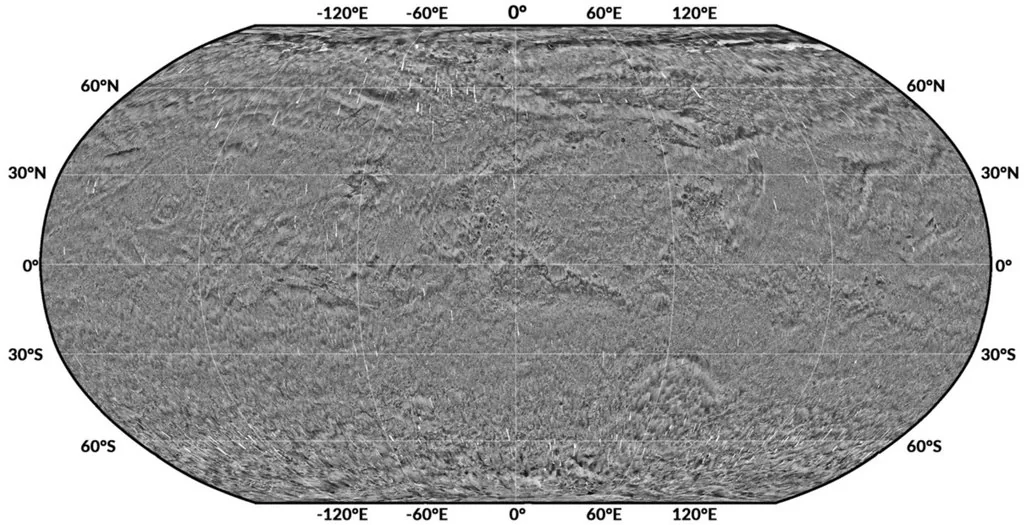
The Mars imagery the detector worked on.
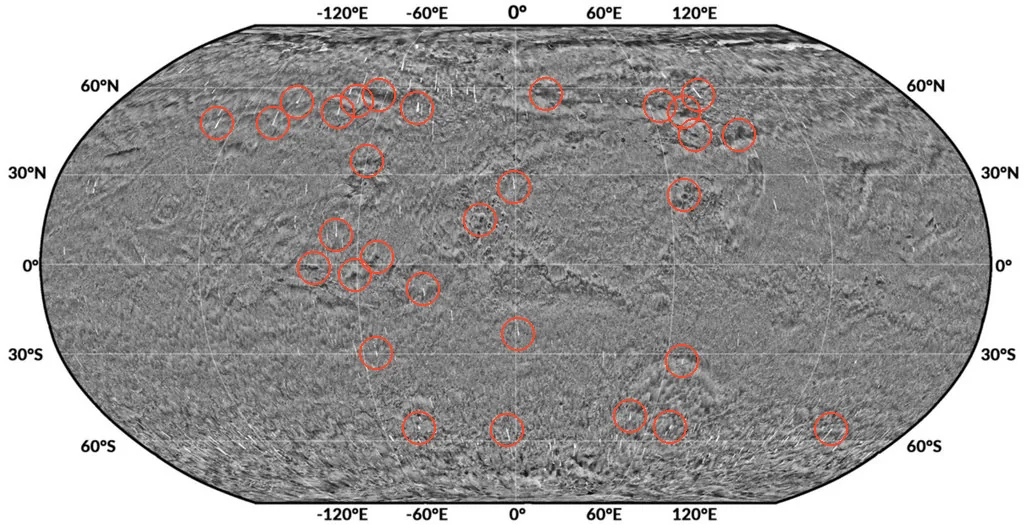
Annotations show how predicted candidates align with the source scene.
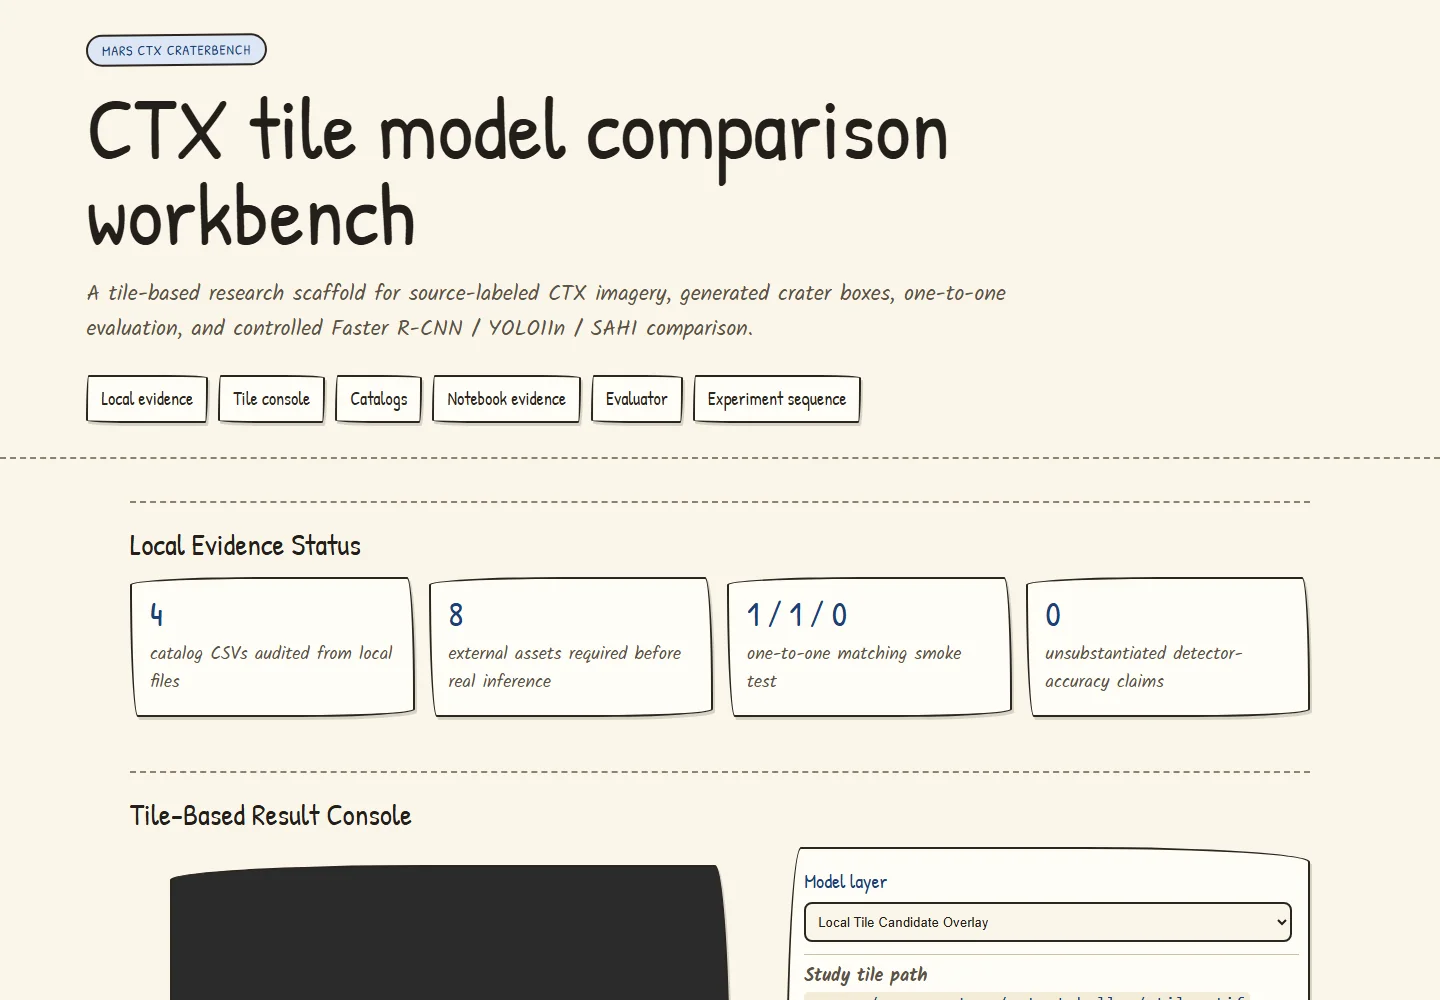
Where the model’s output meets a person looking at it.
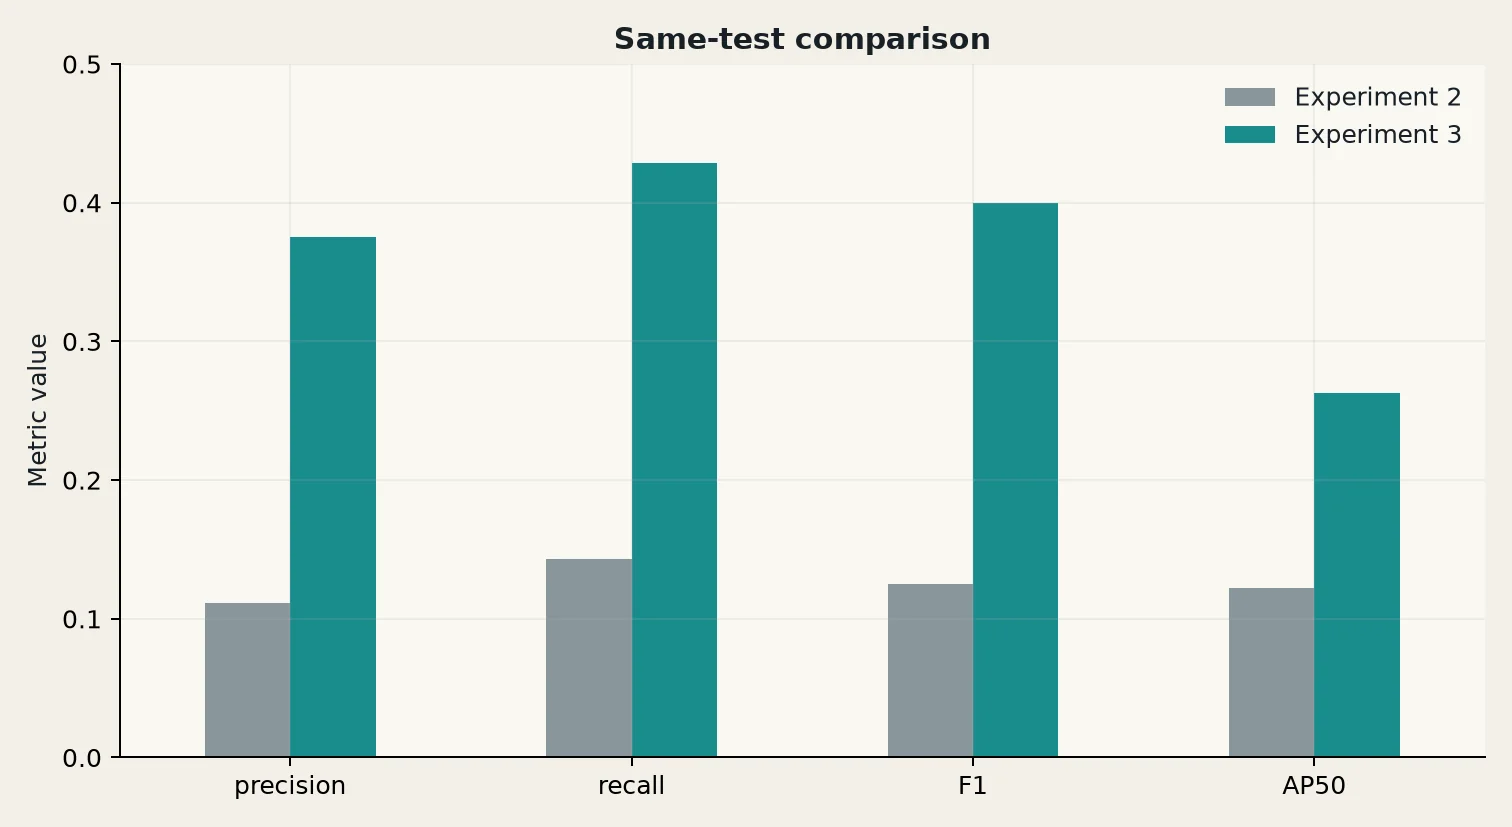
A controlled comparison keeps evaluation conditions fixed across outputs.
| Measure | Result |
|---|---|
| True positives / false positives / misses | 6 / 10 / 8 |
| Precision / recall | 0.375 / 0.429 |
| F1 / AP50 | 0.400 / 0.263 |
| Median matched IoU | 0.663 |
What I built
I built the evaluation side of the project around its research notebooks: checks on the crater catalog, converting catalog positions onto image tiles, splitting the data by geography, removing duplicate detections across overlapping tiles, threshold sweeps, and a manifest for every run so any result can be traced. Then I designed and ran the controlled experiment.
Keeping the test honest
The full benchmark has 2,809 tiles and 1,683 catalog craters. Tiles are 1024 × 1024 px with 128 px of overlap, and crater sizes come from the image’s real scale, not from measuring screenshots.
If the same patch of Mars shows up in both training and test, the model can just remember it. So I checked: zero overlapping tile pairs across splits, and zero craters shared between them.
The first try failed, usefully
A one-epoch YOLO11n run went through the whole pipeline and produced 0 correct detections, 53,878 false alarms and 143 misses. That proved the pipeline ran, nothing more. It’s why the next step was a smaller, controlled experiment instead of a bigger model.
The experiment
Faster R-CNN (ResNet-50 FPN v2), starting from COCO weights, with two classes: crater and background. SGD at a learning rate of 0.002 and momentum 0.9, batches of two crater tiles and two empty tiles, plus flips, right-angle rotations and contrast changes.
Candidate A used the default input size and anchors; Candidate B used fixed 1024 px input and smaller anchors. A did best on validation (AP50 0.292 at epoch 11). Its checkpoint and a 0.8 score threshold were locked before the test set was ever touched.
What came out
Precision 0.375, recall 0.429, F1 0.400, AP50 0.263, median matched IoU 0.663. Seven of the ten false alarms were on tiles with no craters at all. Faint or worn craters and round-looking terrain were the hardest cases. A test set this small can’t tell you how it would do on all of Mars.
Next
More labeled ground from separate regions, more empty tiles that look crater-like, and a brand-new test set. This result stays frozen; tuning on the old test set would make it meaningless.
Sources
Technical records.
Continue exploring.
← Back to Selected Builds