Experiments in Physics · Cryogenic measurement
Copper Hall Effect
Push current through copper, add a magnetic field, and measure the tiny sideways voltage.
Explore the engineering ↓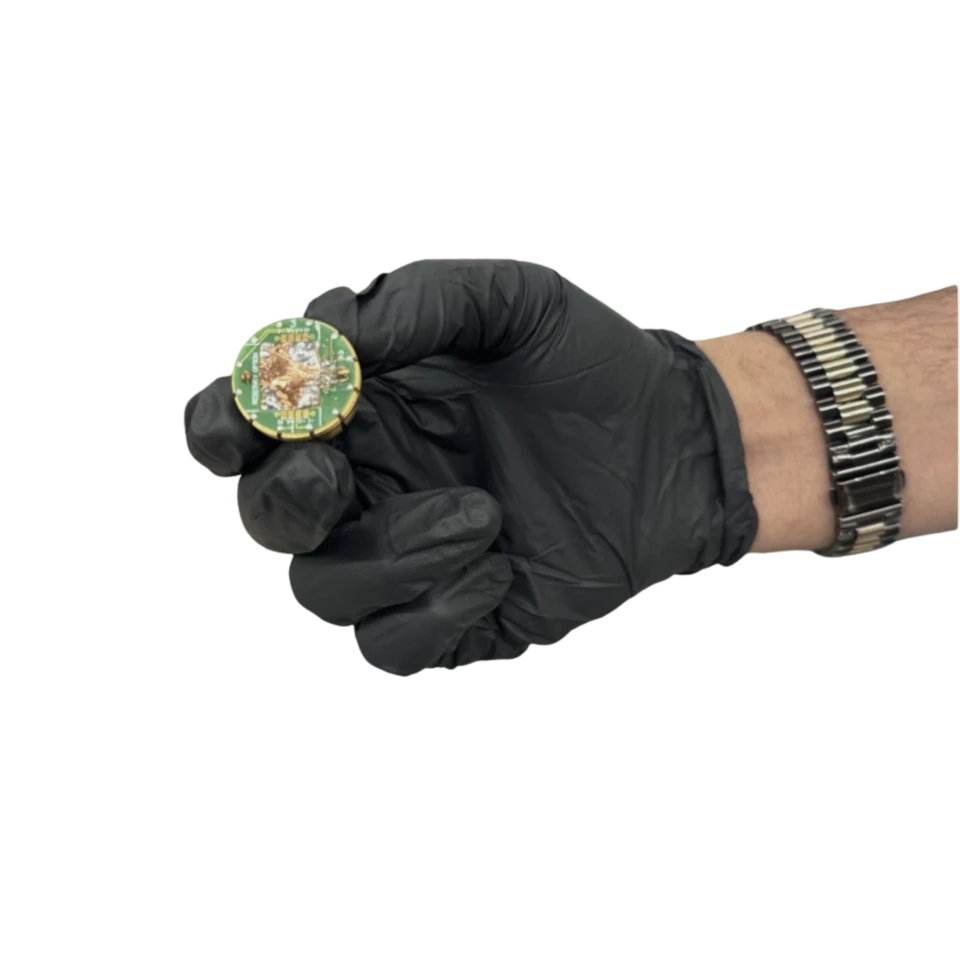
- My role
- Measurement and analysis, as a lab pair
- Status
- Measured at 250 K and 300 K
- Focus
- Cryogenic transport · regression · uncertainty
What we found
At both temperatures the Hall slope came out negative, which means electrons carry the current. The carrier density matched what you’d expect for a metal to within an order of magnitude.
- 01
Prepare
Mount the copper sample and wire it up.
- 02
Sweep
Hold the current fixed and sweep the field in both directions.
- 03
Fit
Fit the slope of sideways resistance against field.
- 04
Propagate
Carry the slope and thickness uncertainty through to carrier density.
In the lab
Inside the work.
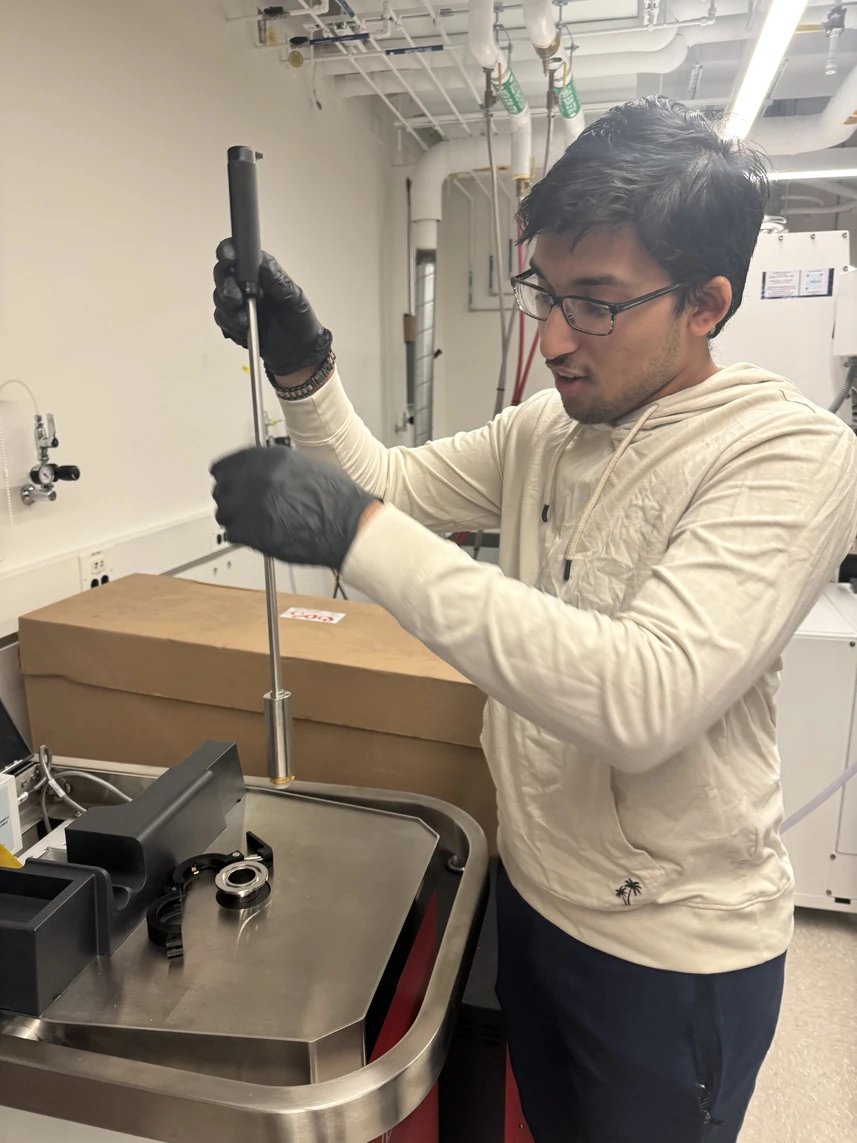
The measurement system and the sample stage.
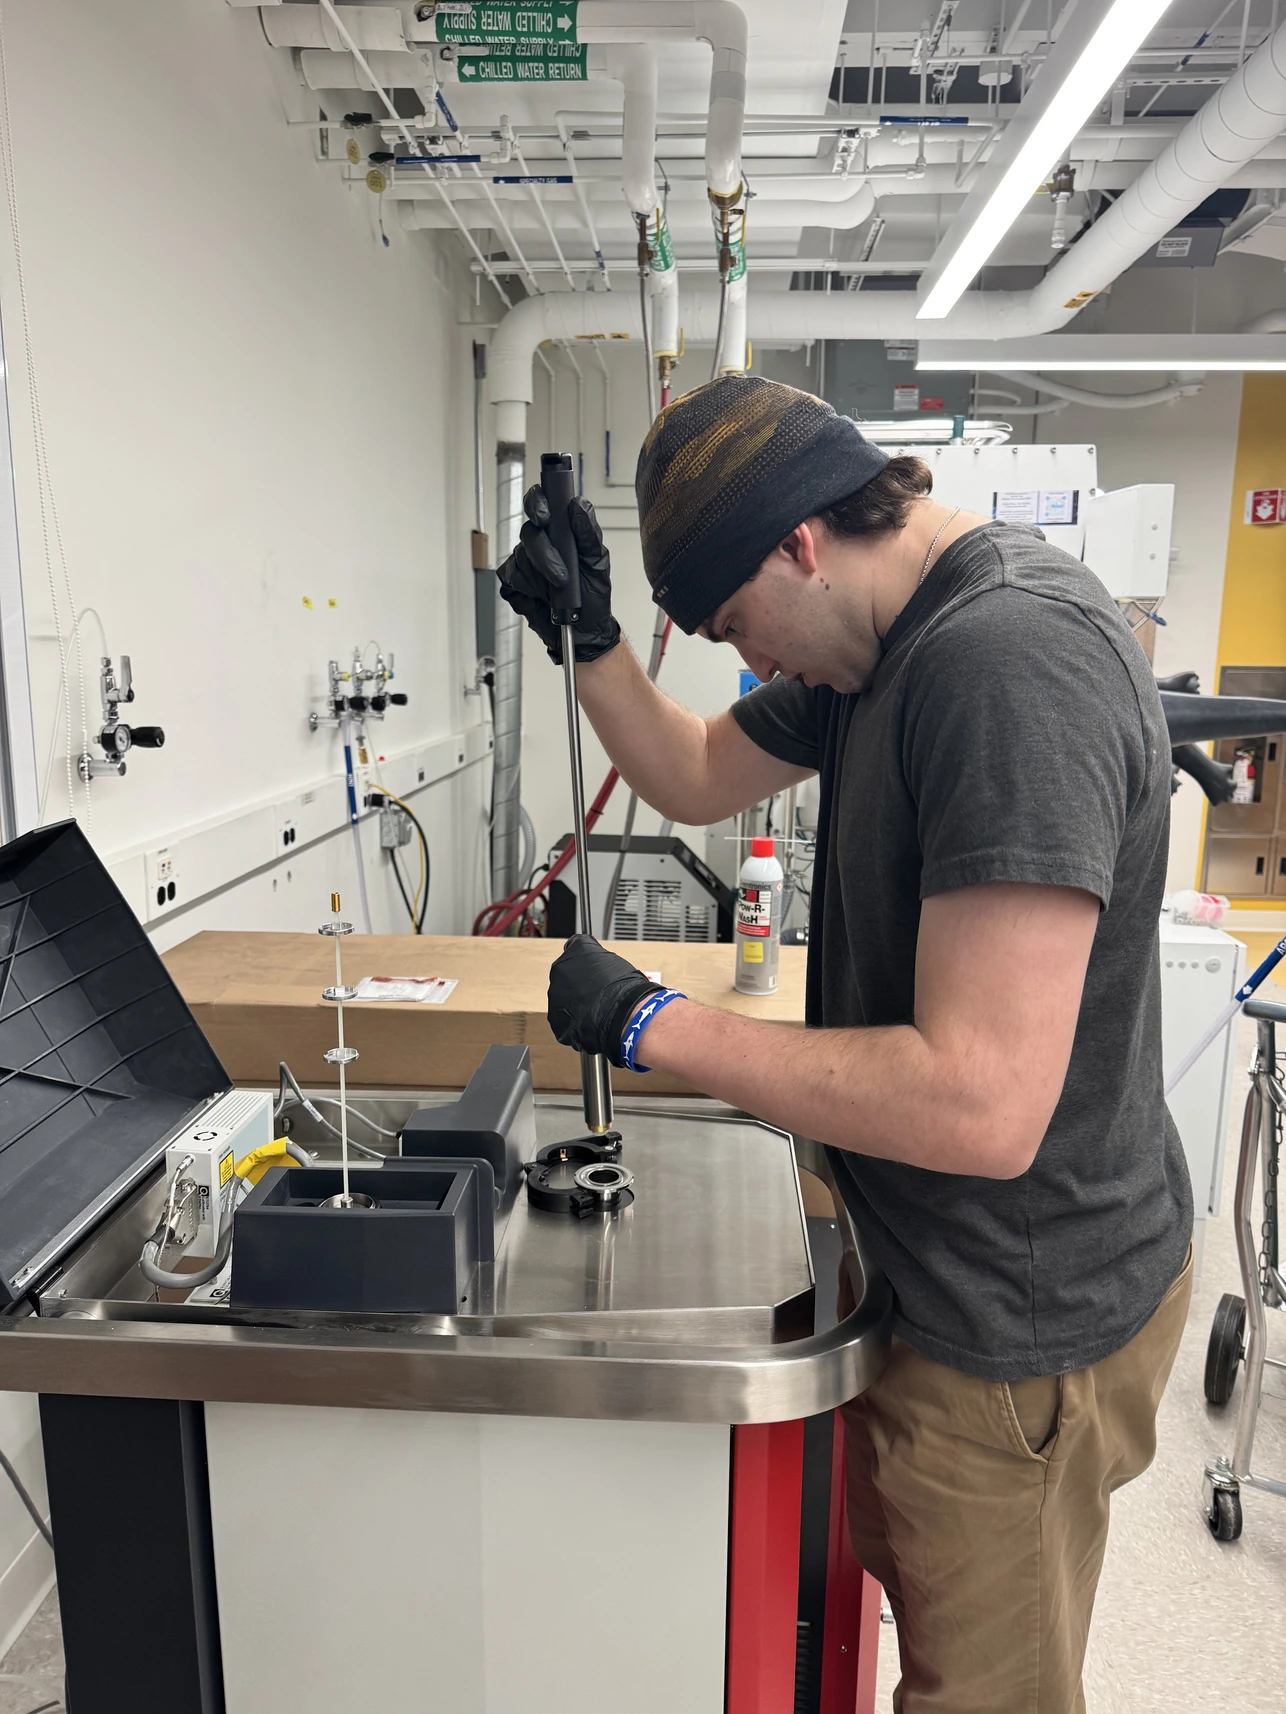
Getting the copper sample onto the stage.
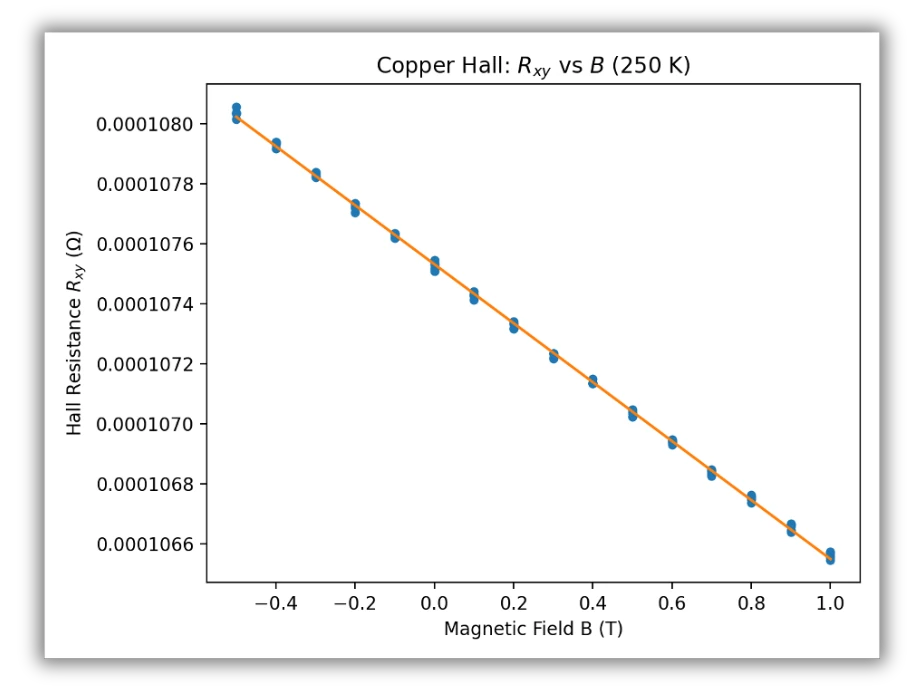
Resistance against field: a clean negative slope.
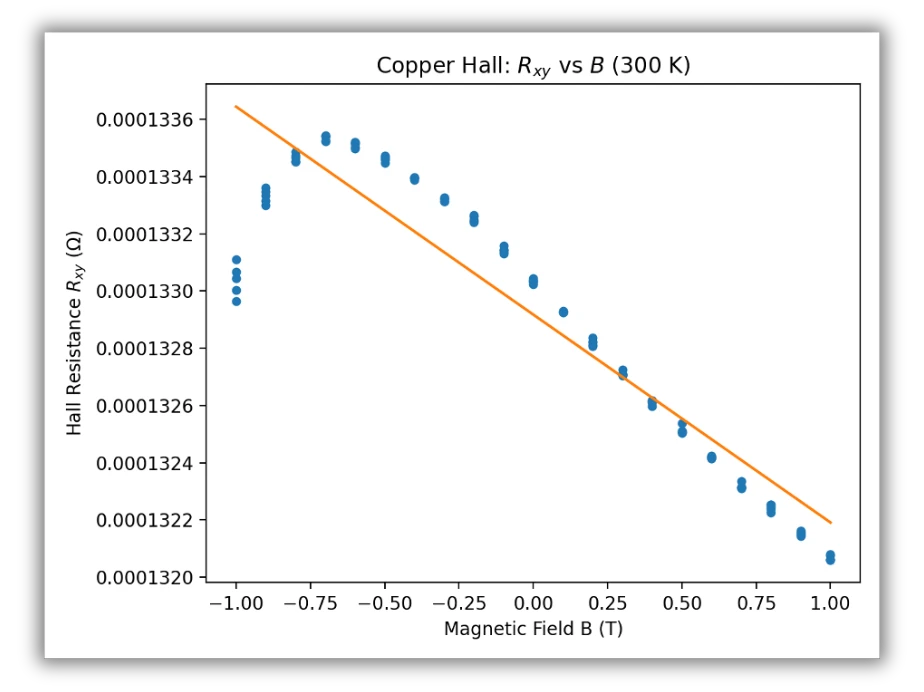
More scatter at room temperature. Worth looking at the points around the line, not just the line.
Why the signal is so small
Push current through a conductor in a magnetic field and the field shoves the moving charges to one side. That builds a small voltage across the sample. The voltage goes as one over the number of carriers, and copper has an enormous number of free electrons, so the signal is tiny. Our sample was 12.71 × 10.99 mm and only 0.10 mm thick (±5 µm).
From a slope to a carrier density
We fit the slope m = dRxy/dB. The Hall coefficient is RH = t·m, and if one type of carrier does all the work, the carrier density is n = 1/(|e|·|RH|). A negative slope means those carriers are electrons.
Where the uncertainty comes from
The thickness alone is ±5 µm on 0.10 mm, which is already 5%. Adding the fit error on the slope, σRH/|RH| = √[(σt/t)² + (σm/m)²], and carrier density inherits the same fractional uncertainty because it’s just one over RH. So however good the fit is, this setup can’t do better than about 5%.
Comparing the two temperatures
At 300 K the slope was a little smaller and the data noisier than at 250 K. Both agree with a metal’s carrier density to within an order of magnitude. Two plots can’t prove temperature caused every difference, though: contact alignment, the copper’s grain structure and the fit itself all play a part.
The next run would be zinc. Zinc is known for a positive Hall coefficient, so the sign should flip, which makes it a good check that the setup measures what we think it does.
Sources
Technical records.
Continue exploring.
← Back to Selected Builds